
According to CMC: August Crypto Market Overview
Bitcoin steadies, altseason builds momentum, stablecoins evolve post-GENIUS Act, and digital asset treasuries reshape crypto markets.
Chapter 1: Market Overview
Market eyes ATH — Are we breaking the spell of bad Augusts?
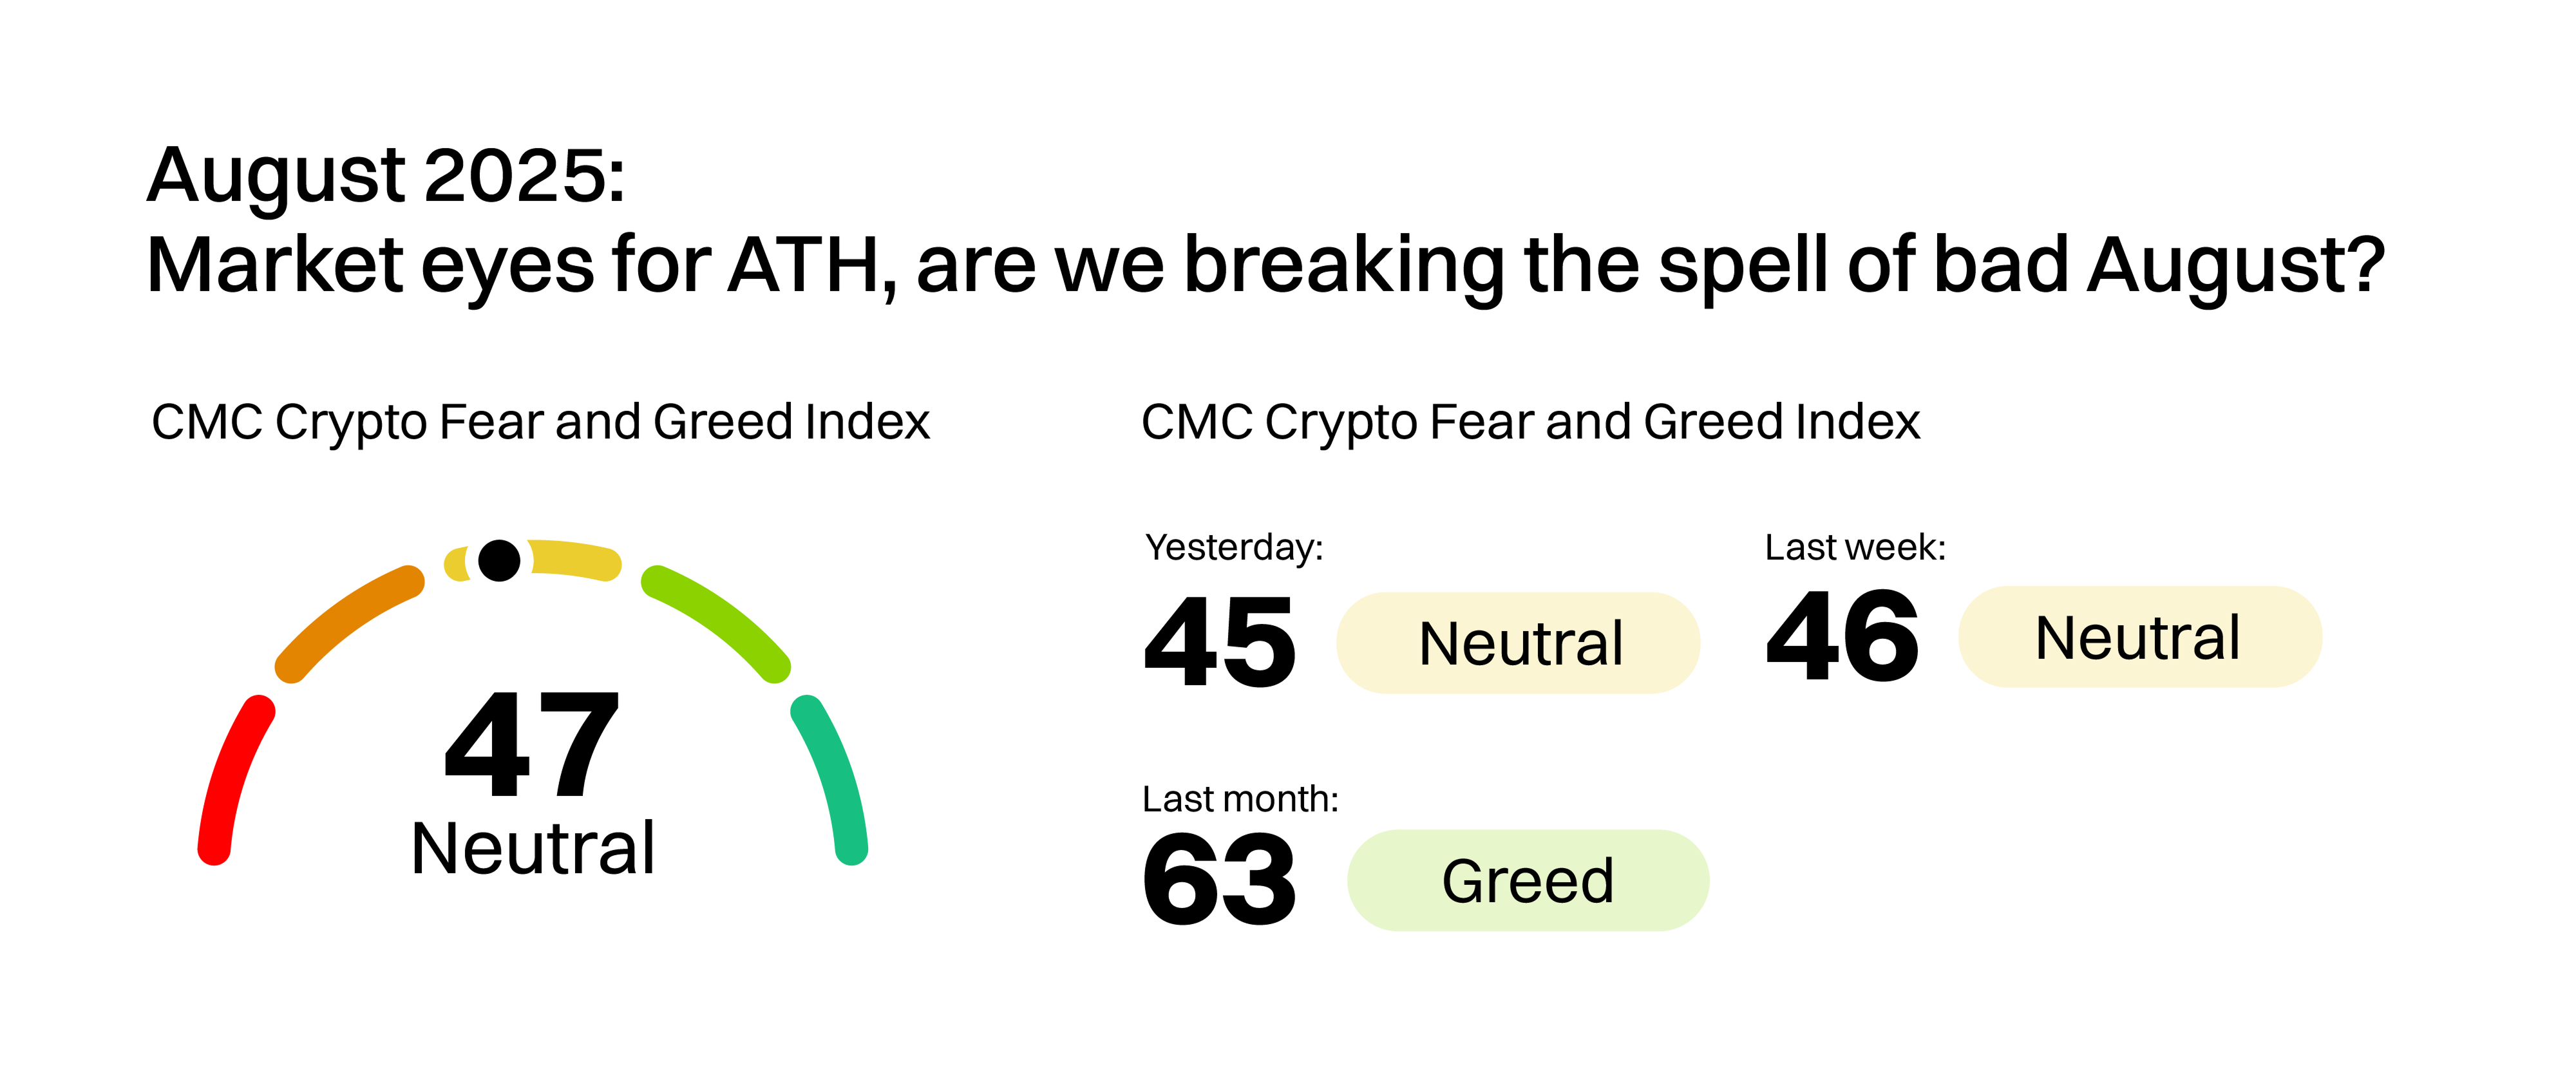
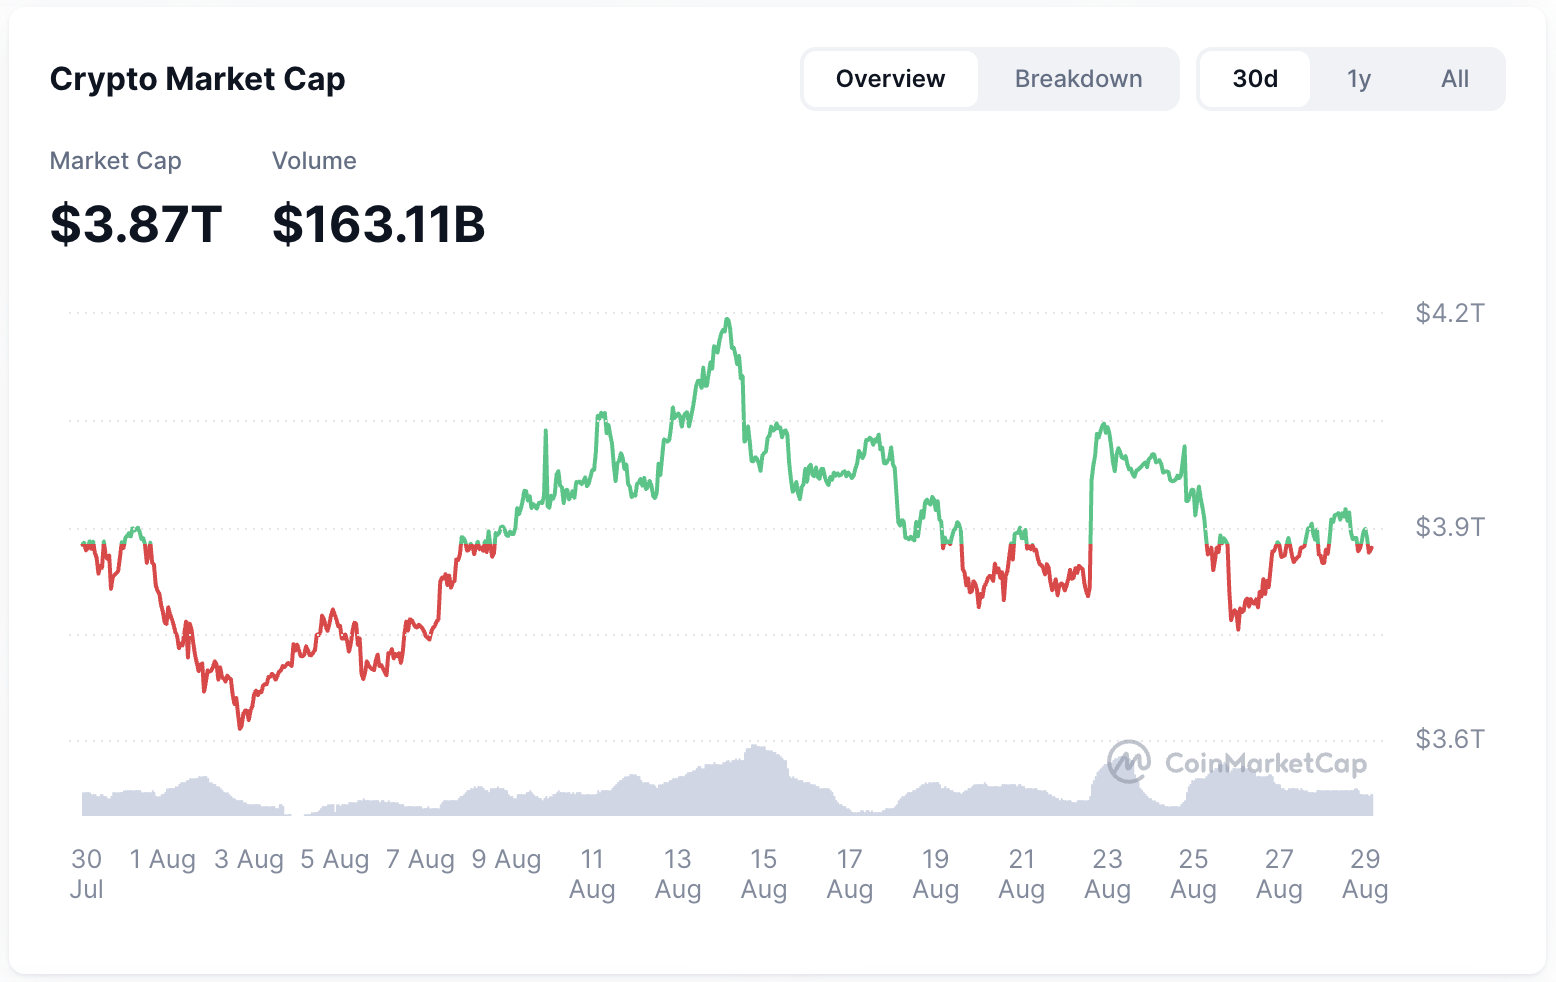
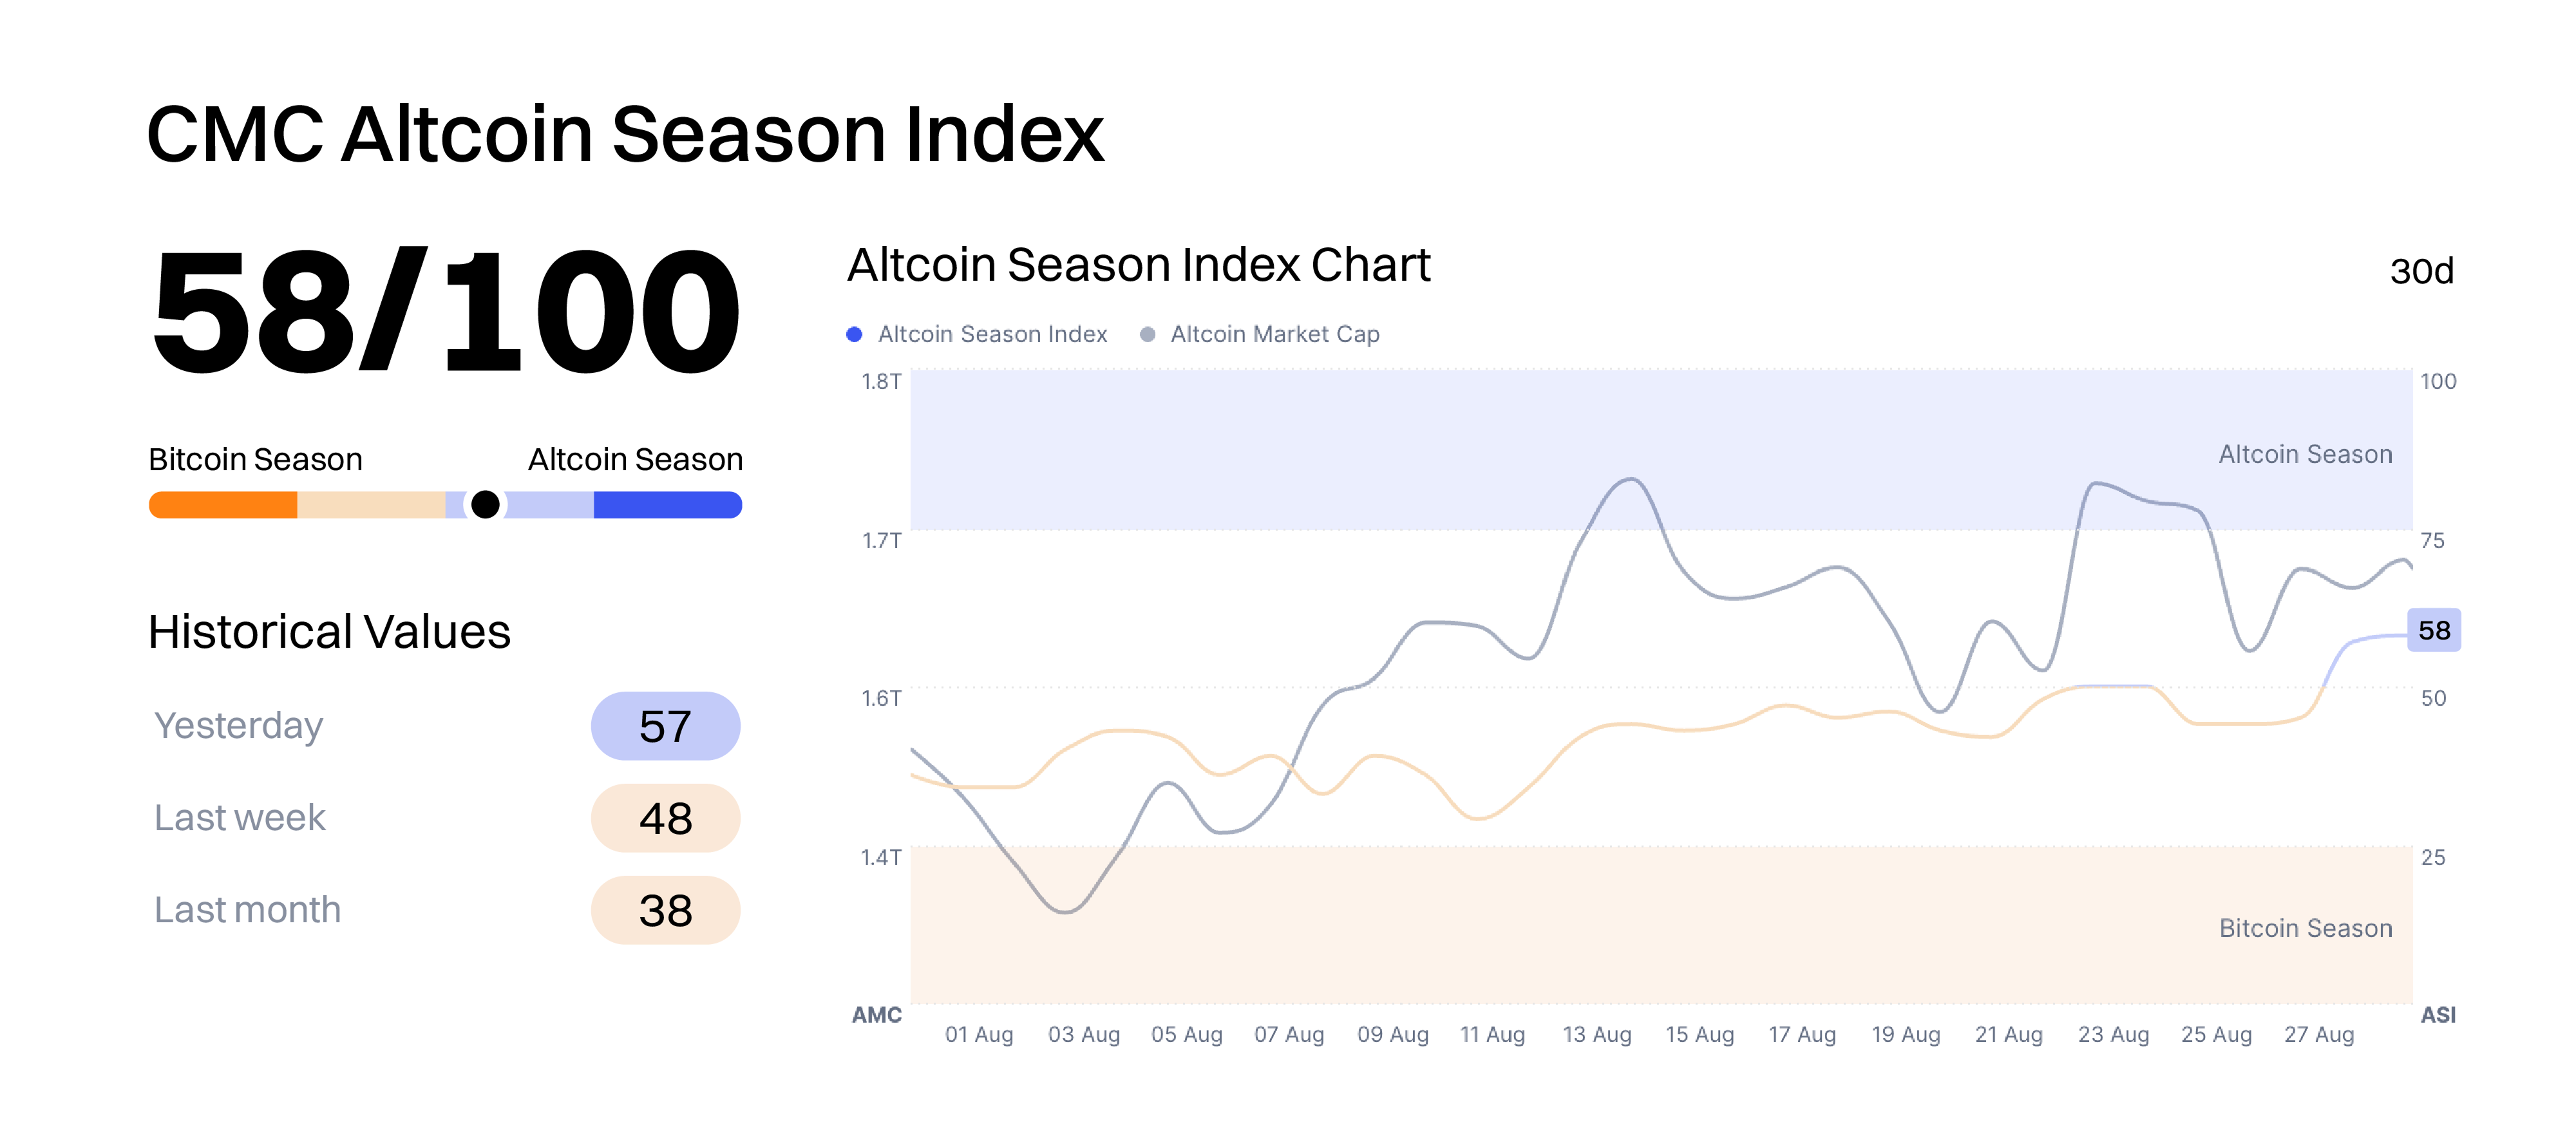
Altcoin Market Sees Clear Upward Momentum
For now, August feels less like a peak and more like the overture — the early notes of altcoin season building toward something louder.
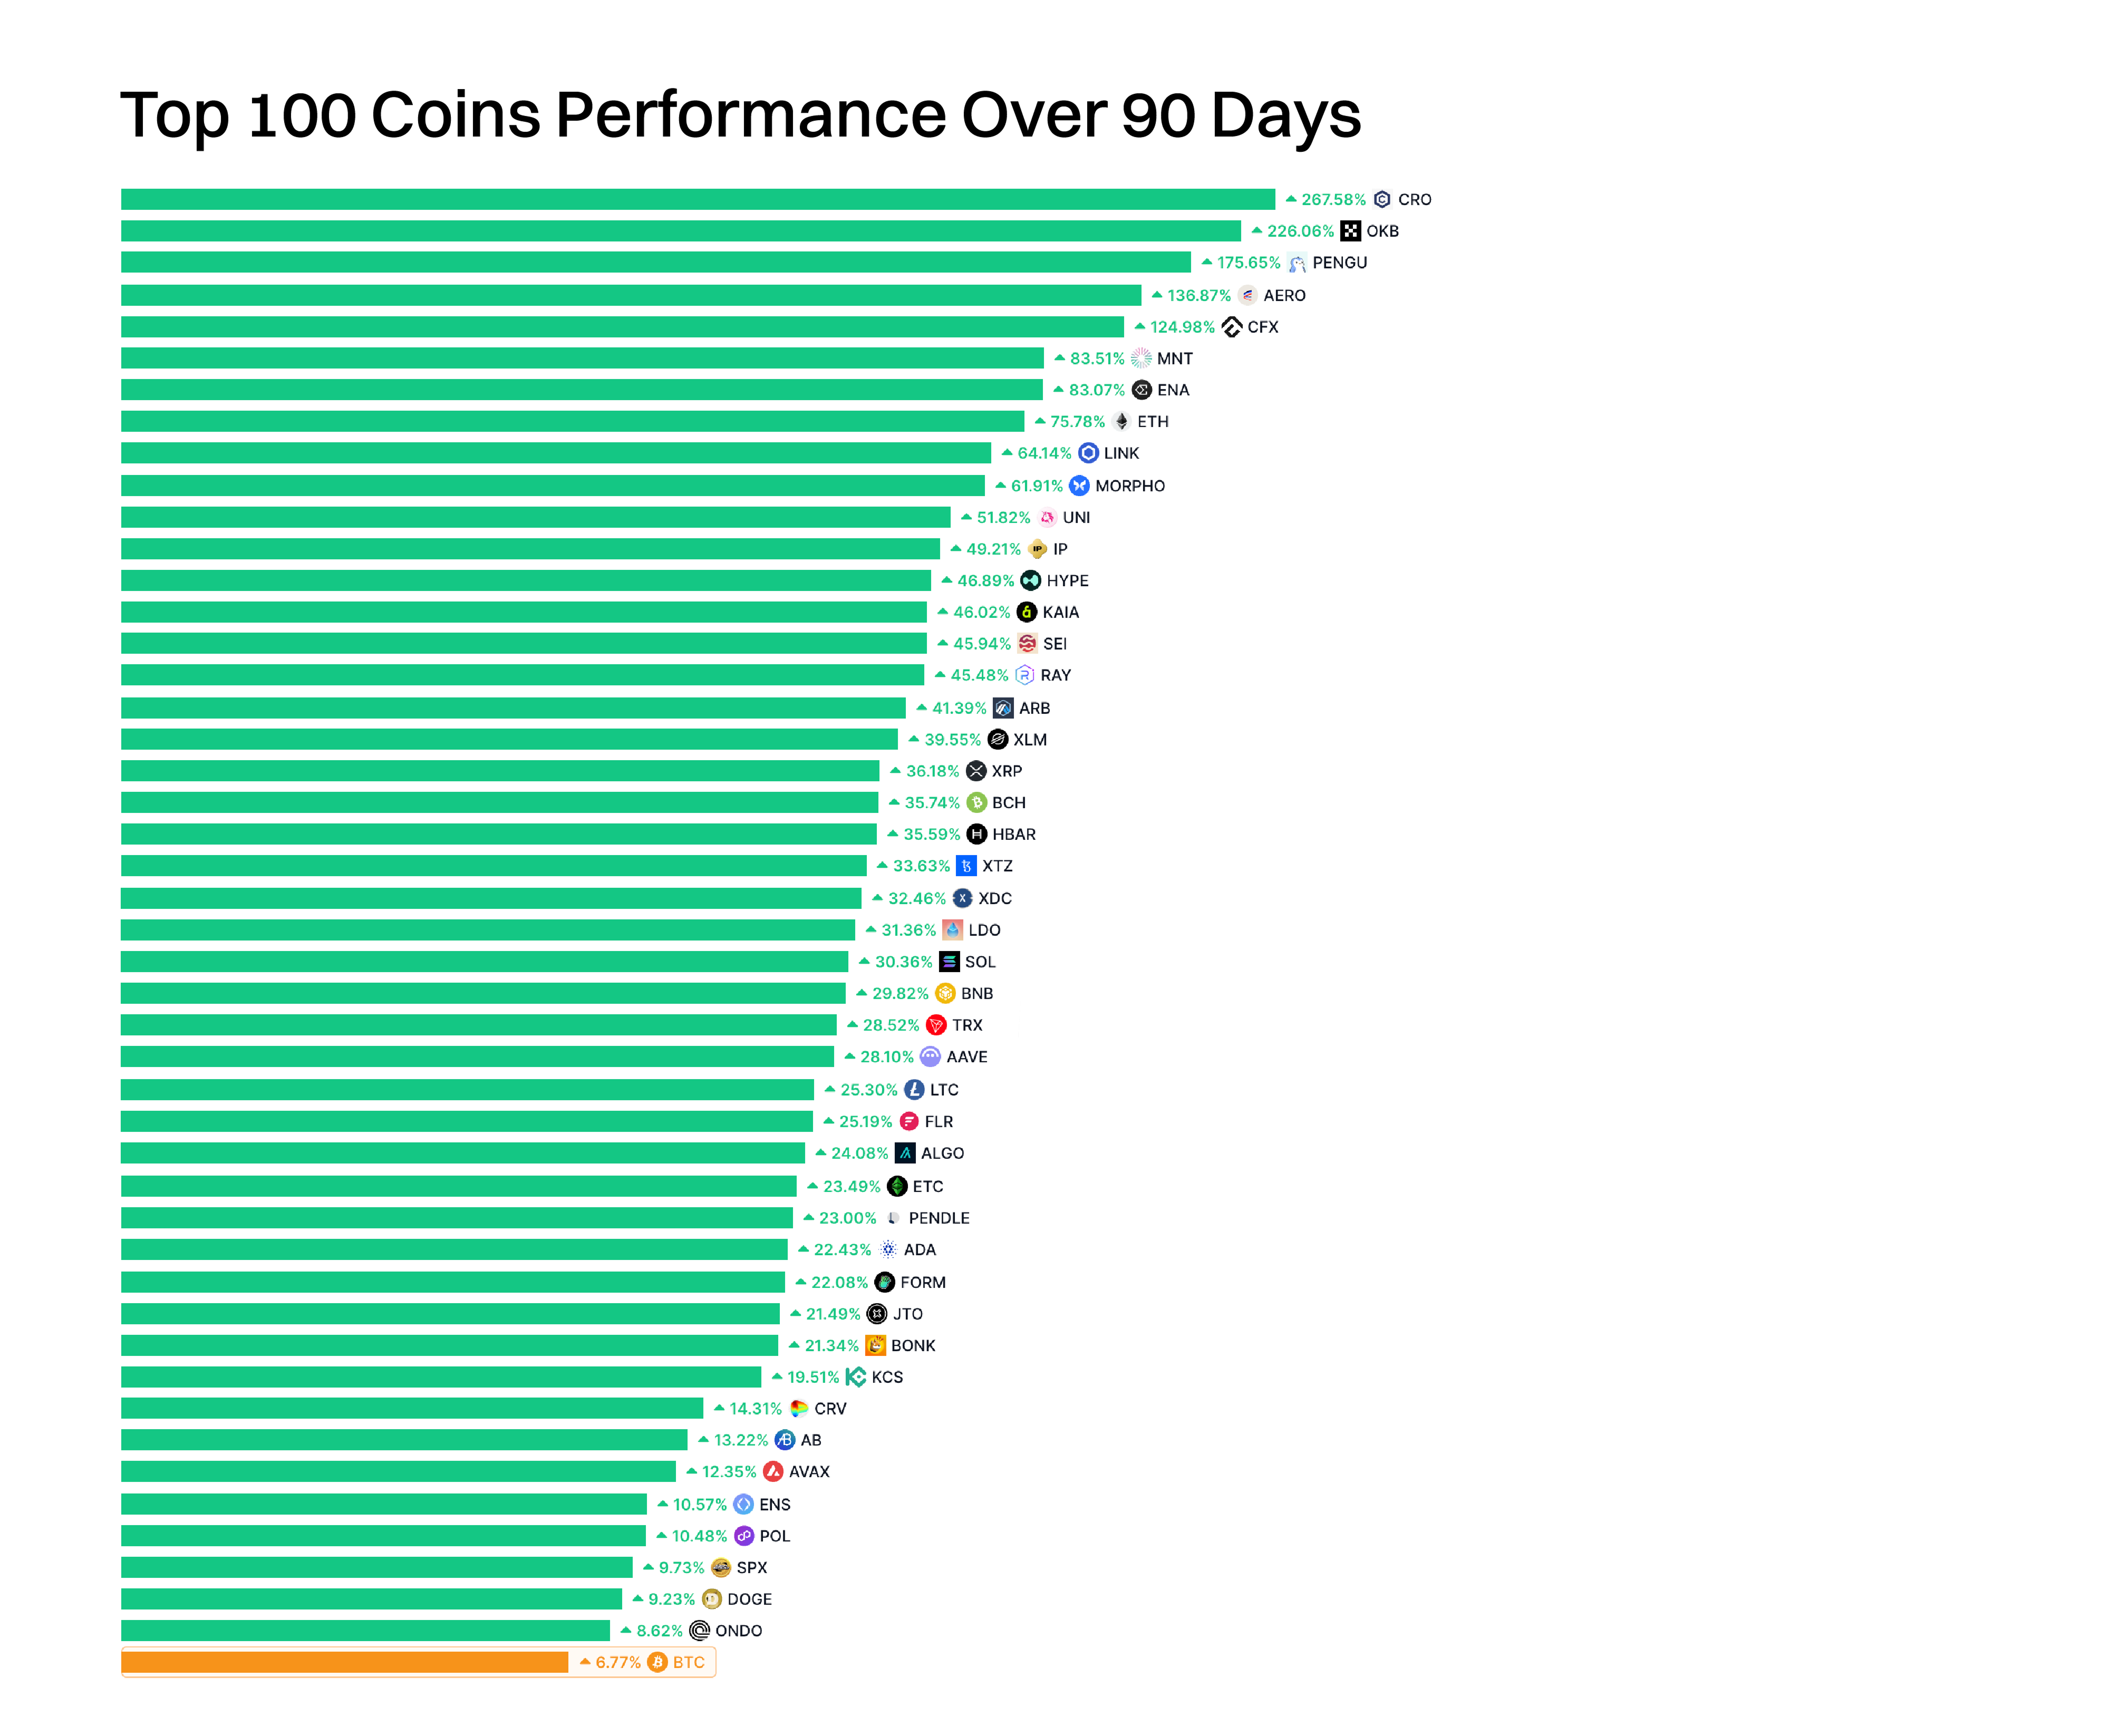
Top Gainers/Losers This Month (from CMC Top 100 projects)
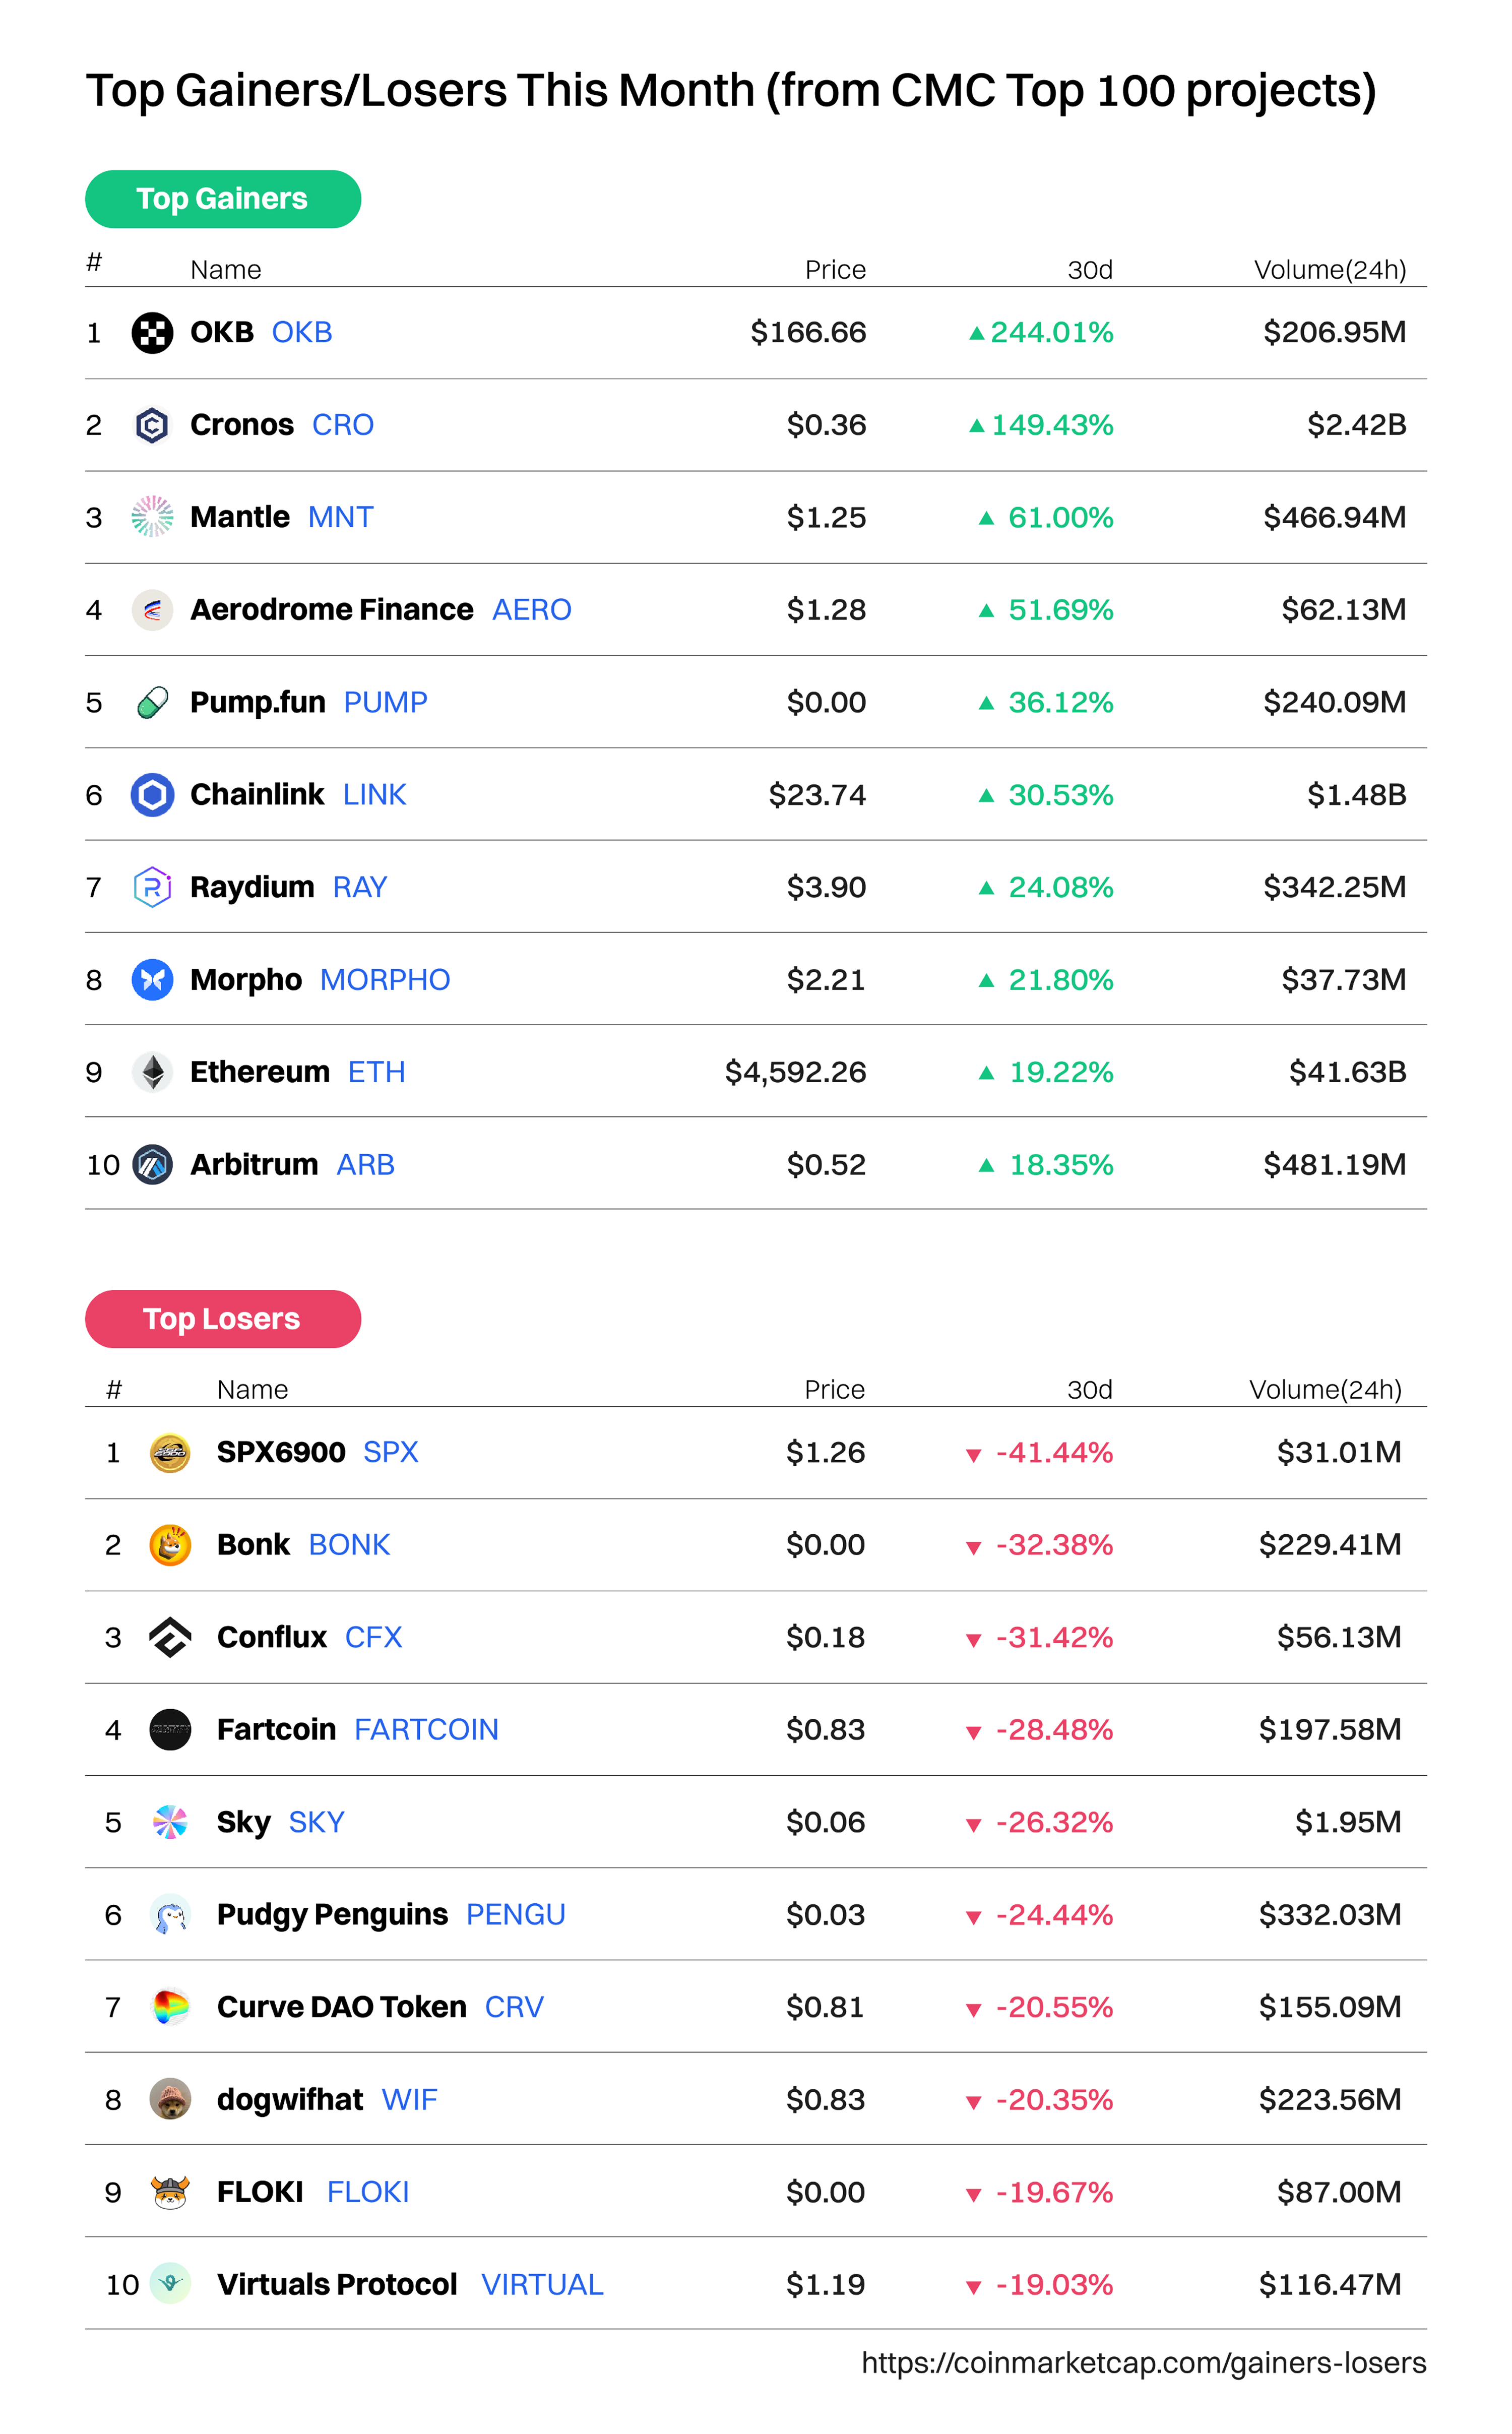
Taken together, the month’s losers illustrate a market that is becoming more selective. Speculation is still present but losing dominance as capital gravitates away from meme-driven froth and experimental tokens and places a premium on utility, treasury strength and sustainable yield.
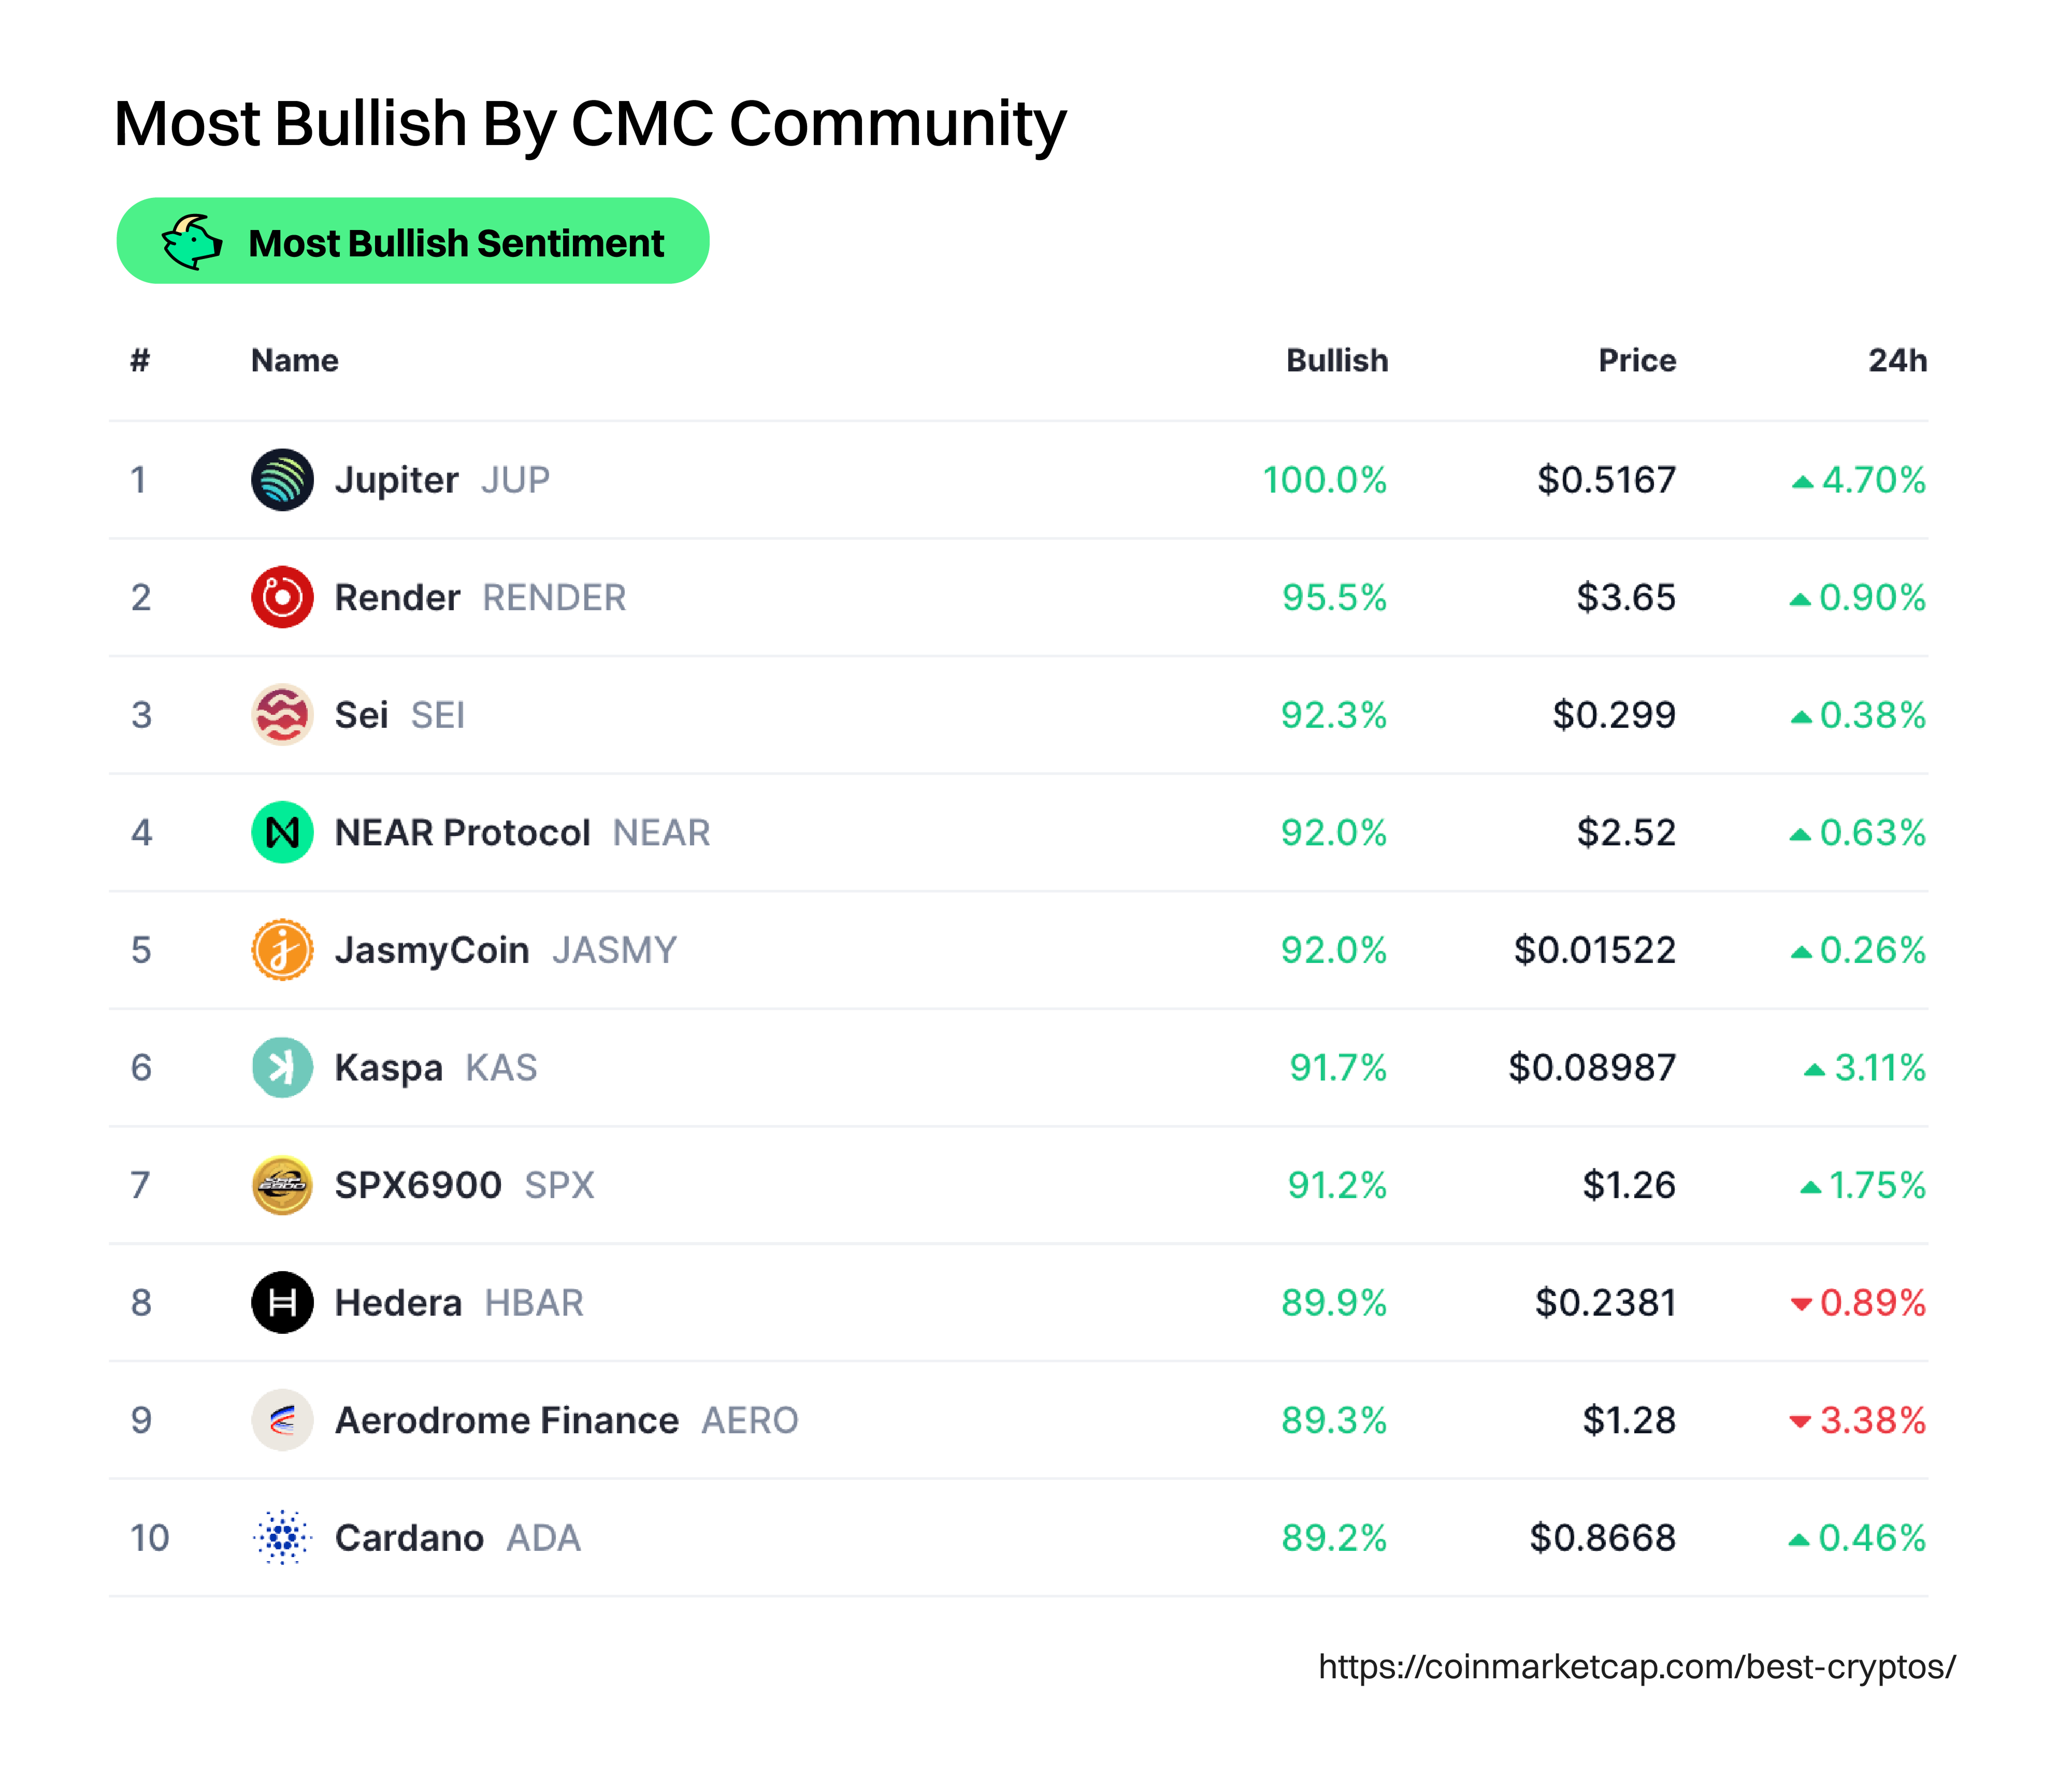
Most Bullish By CMC Community
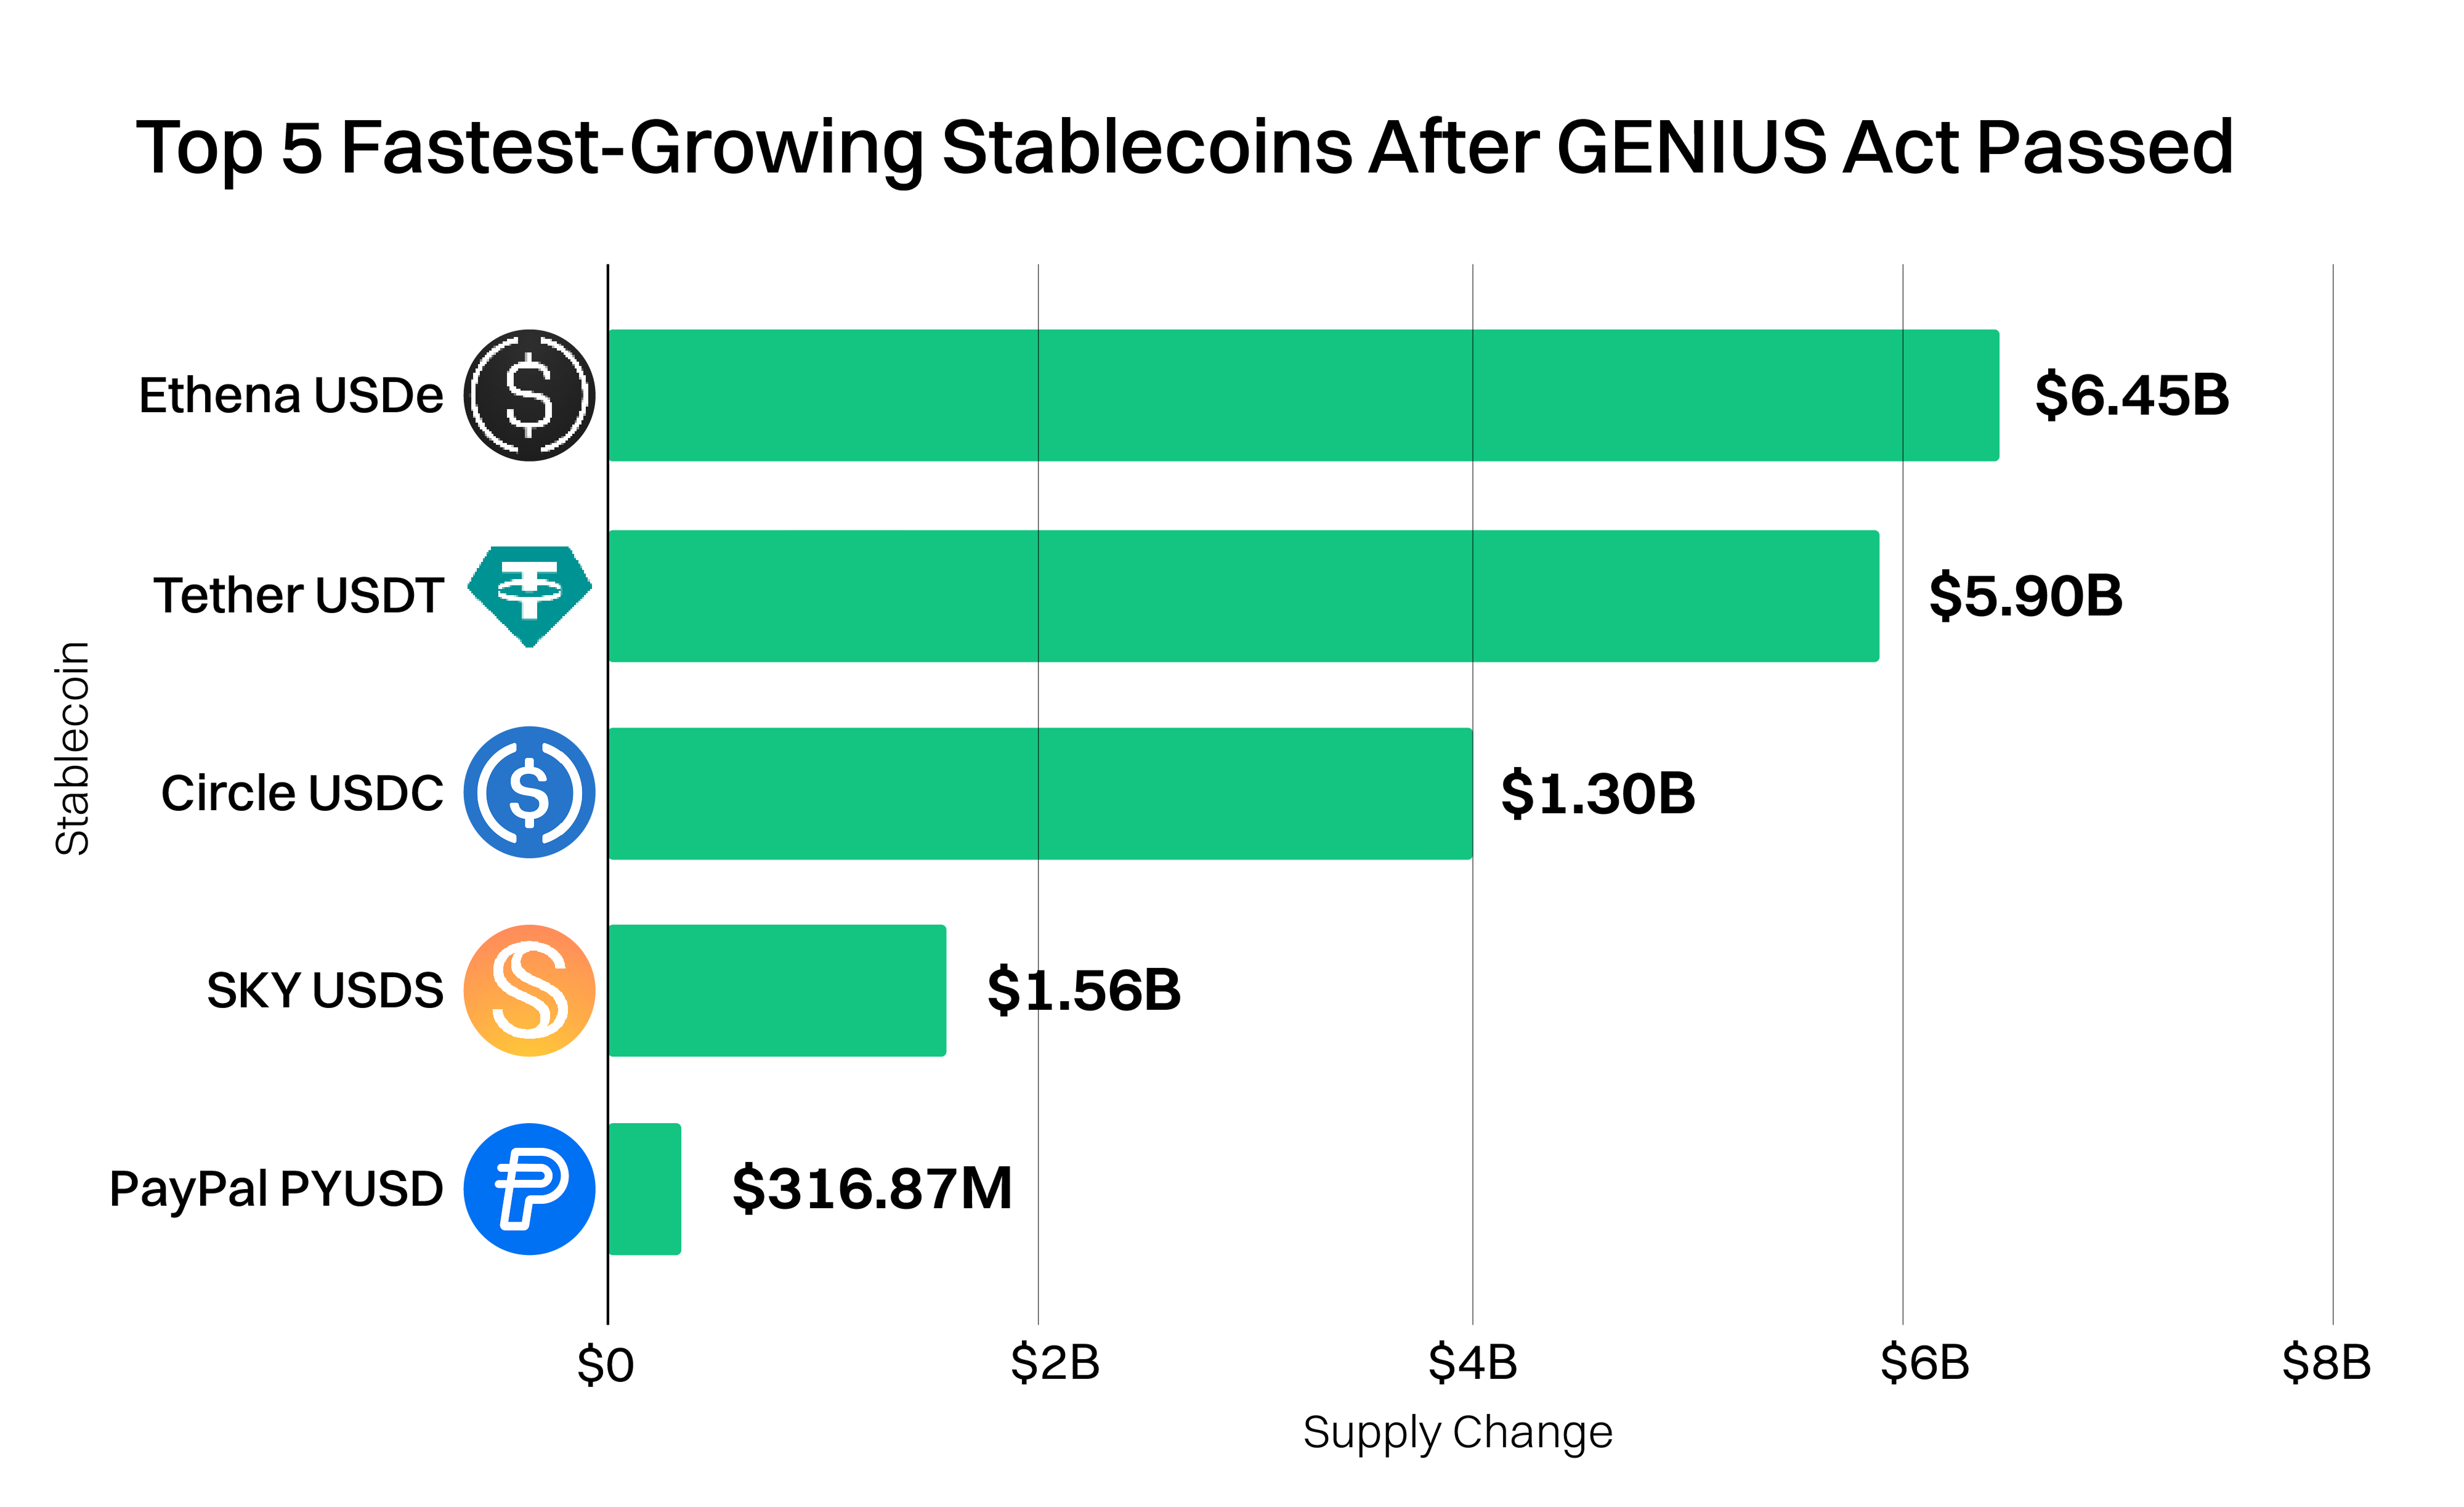
Chapter 2: Stablecoins Redefined Following the GENIUS Act
Chapter 3: Digital Asset Treasuries: BTC Fortress vs. ETH Yield Play
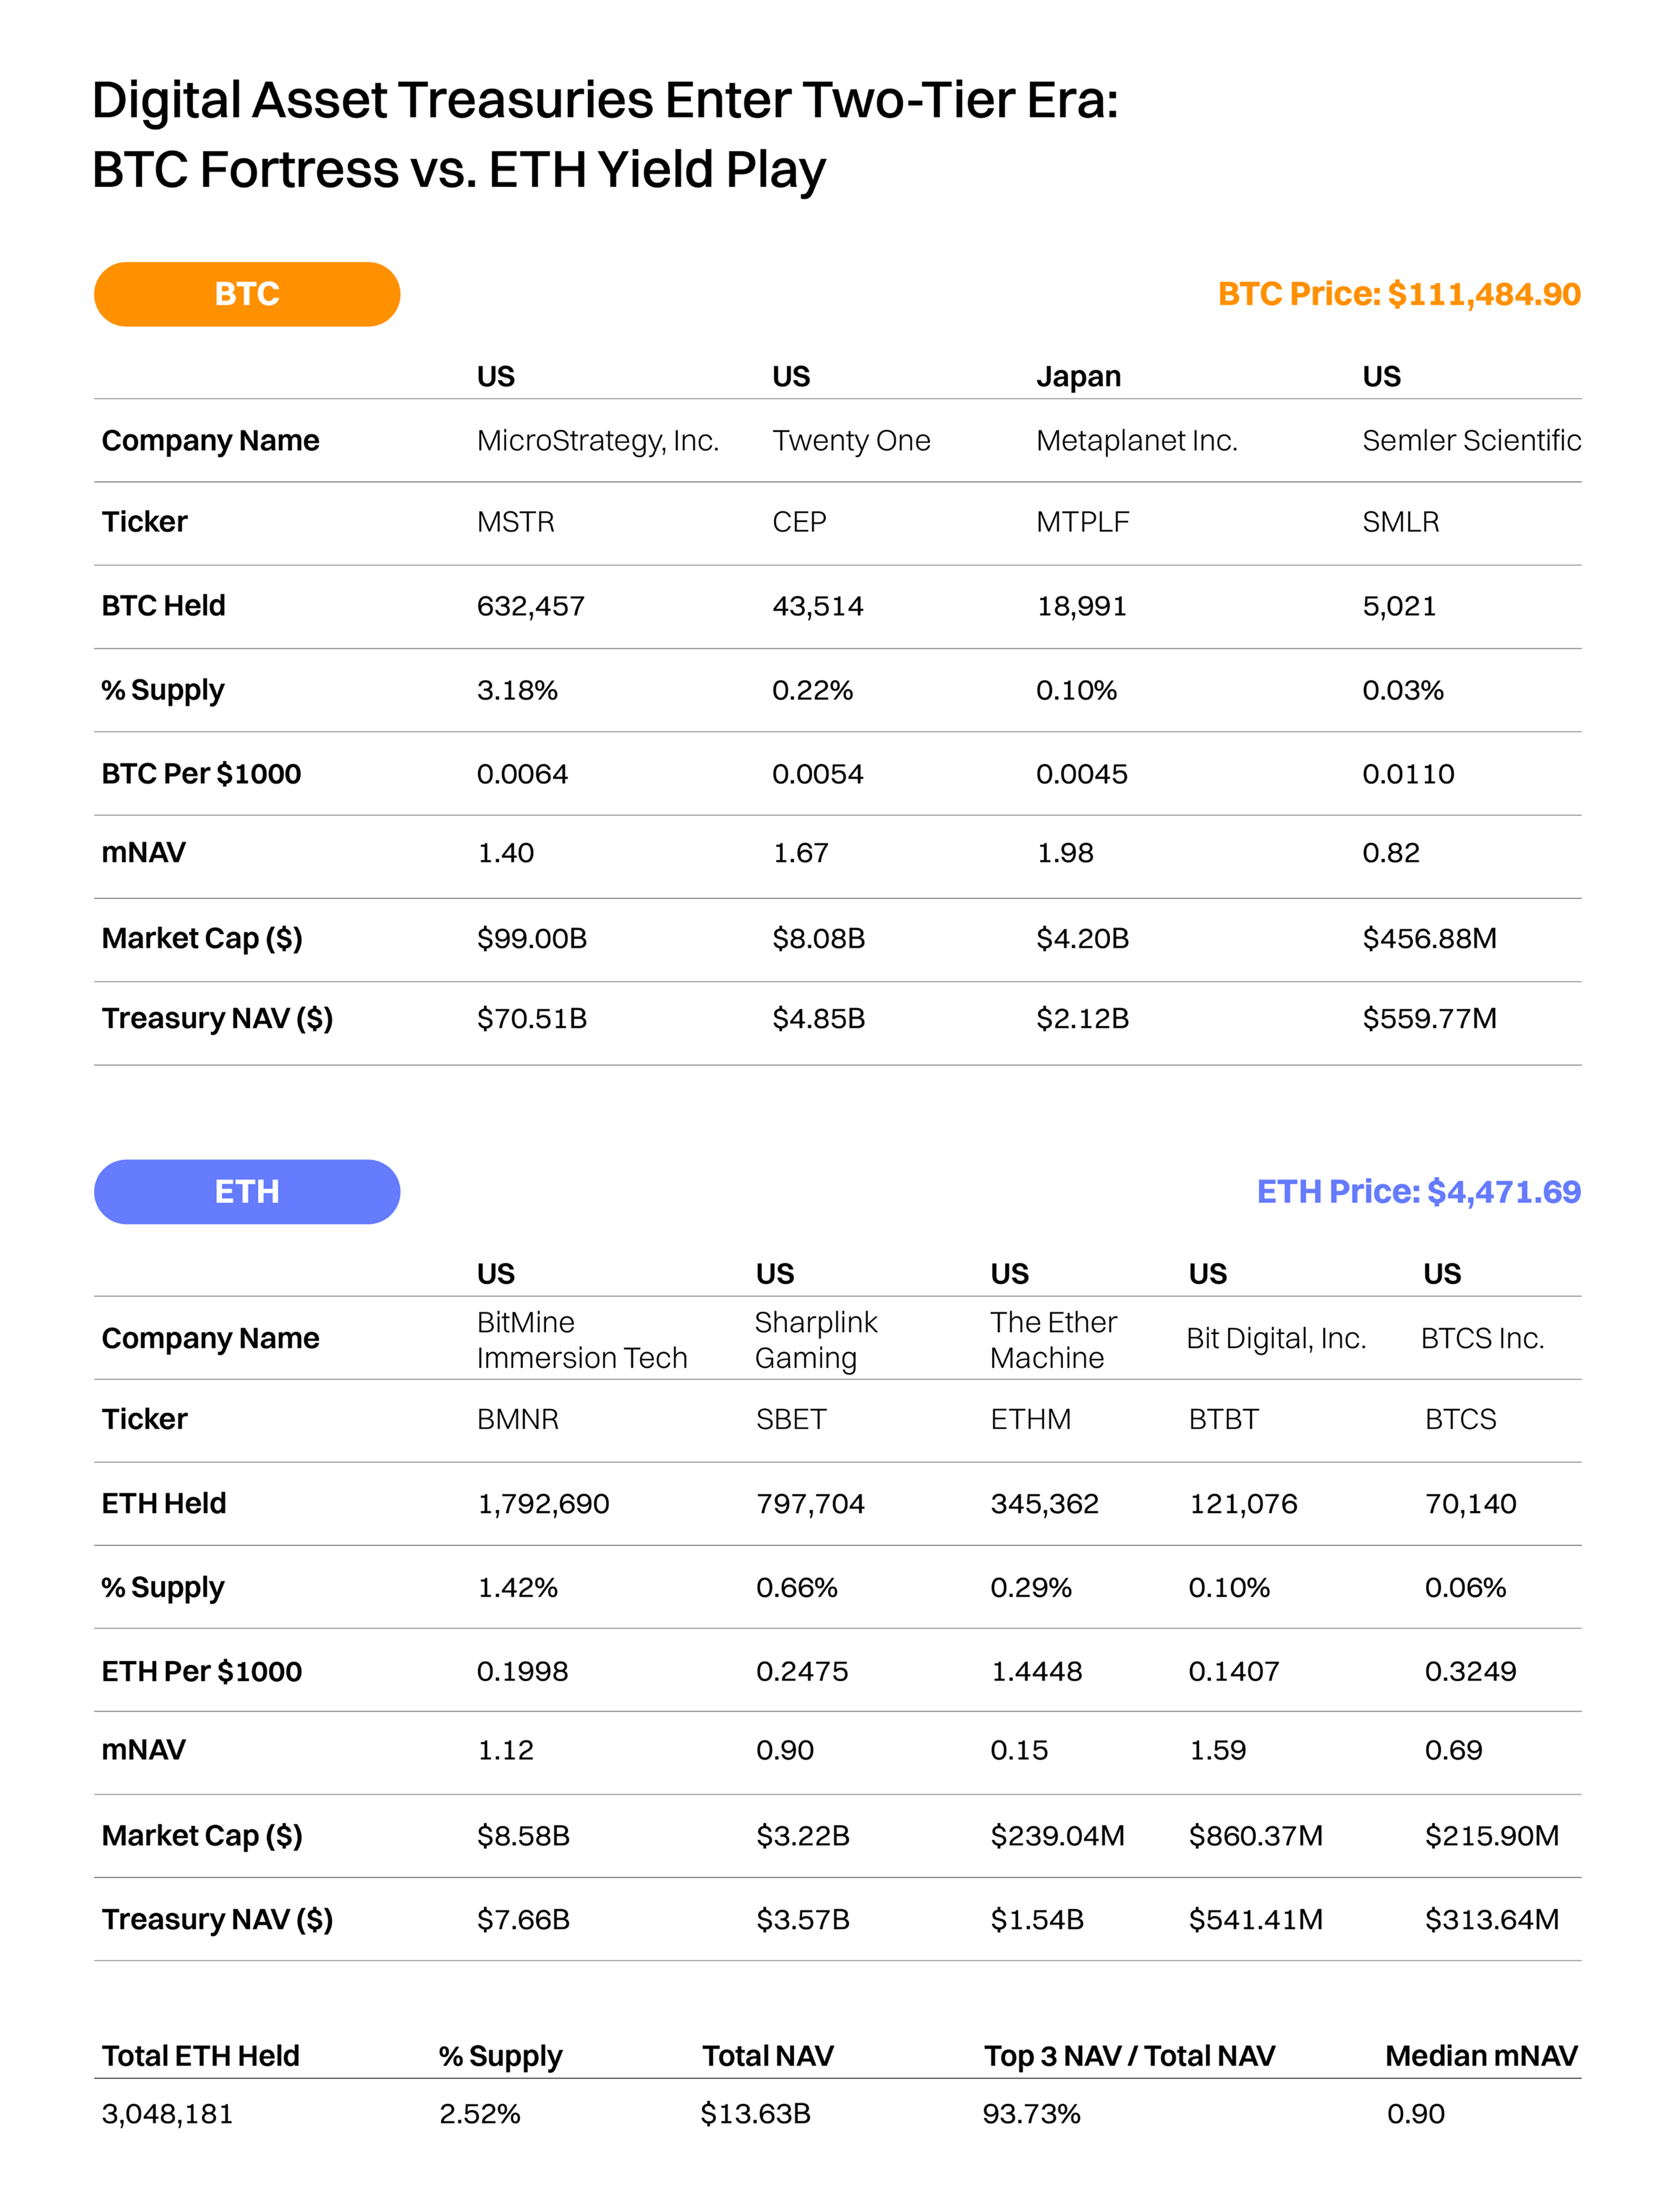
Both BTC and ETH DATs exhibit notable head effects, with MicroStrategy (BTC) and BitMine (ETH) showing a cliff-like lead in market cap, treasury NAV, and trading volume. Wall Street trusted spokesmen like Michael Saylor and Tom Lee drive their dominance, while other crypto DATs lacking such figures lag behind.
Digital asset treasury companies operate as hybrid vehicles between traditional equities and direct crypto holdings. Their model is simple yet powerful: By holding significant amounts of crypto assets, they trade at a stock market capitalization that often exceeds the value of their underlying treasury. This premium allows them to raise capital in public markets and continuously accumulate more crypto.
For investors restricted from direct exposure to digital assets, DATs provide a proxy, with the added advantage that higher premiums translate into more buying power and faster crypto accumulation per share.
itcoin Dominance and Market Leadership
- Scale effect: Strategy’s treasury alone holds over 632,457 BTC (3.2% of Bitcoin’s circulating supply), dwarfing other BTC-focused treasuries such as Twenty One and Metaplanet.
- Premium dynamics: With $MSTR trading at a significant premium to its treasury NAV, it effectively acts as a leveraged Bitcoin vehicle, giving shareholders amplified exposure.
This creates a “head effect” in the Bitcoin DAT market, where a few dominant players concentrate most of the value and liquidity, leaving smaller DATs with marginal influence.
Ethereum DATs: The Emerging Challenger
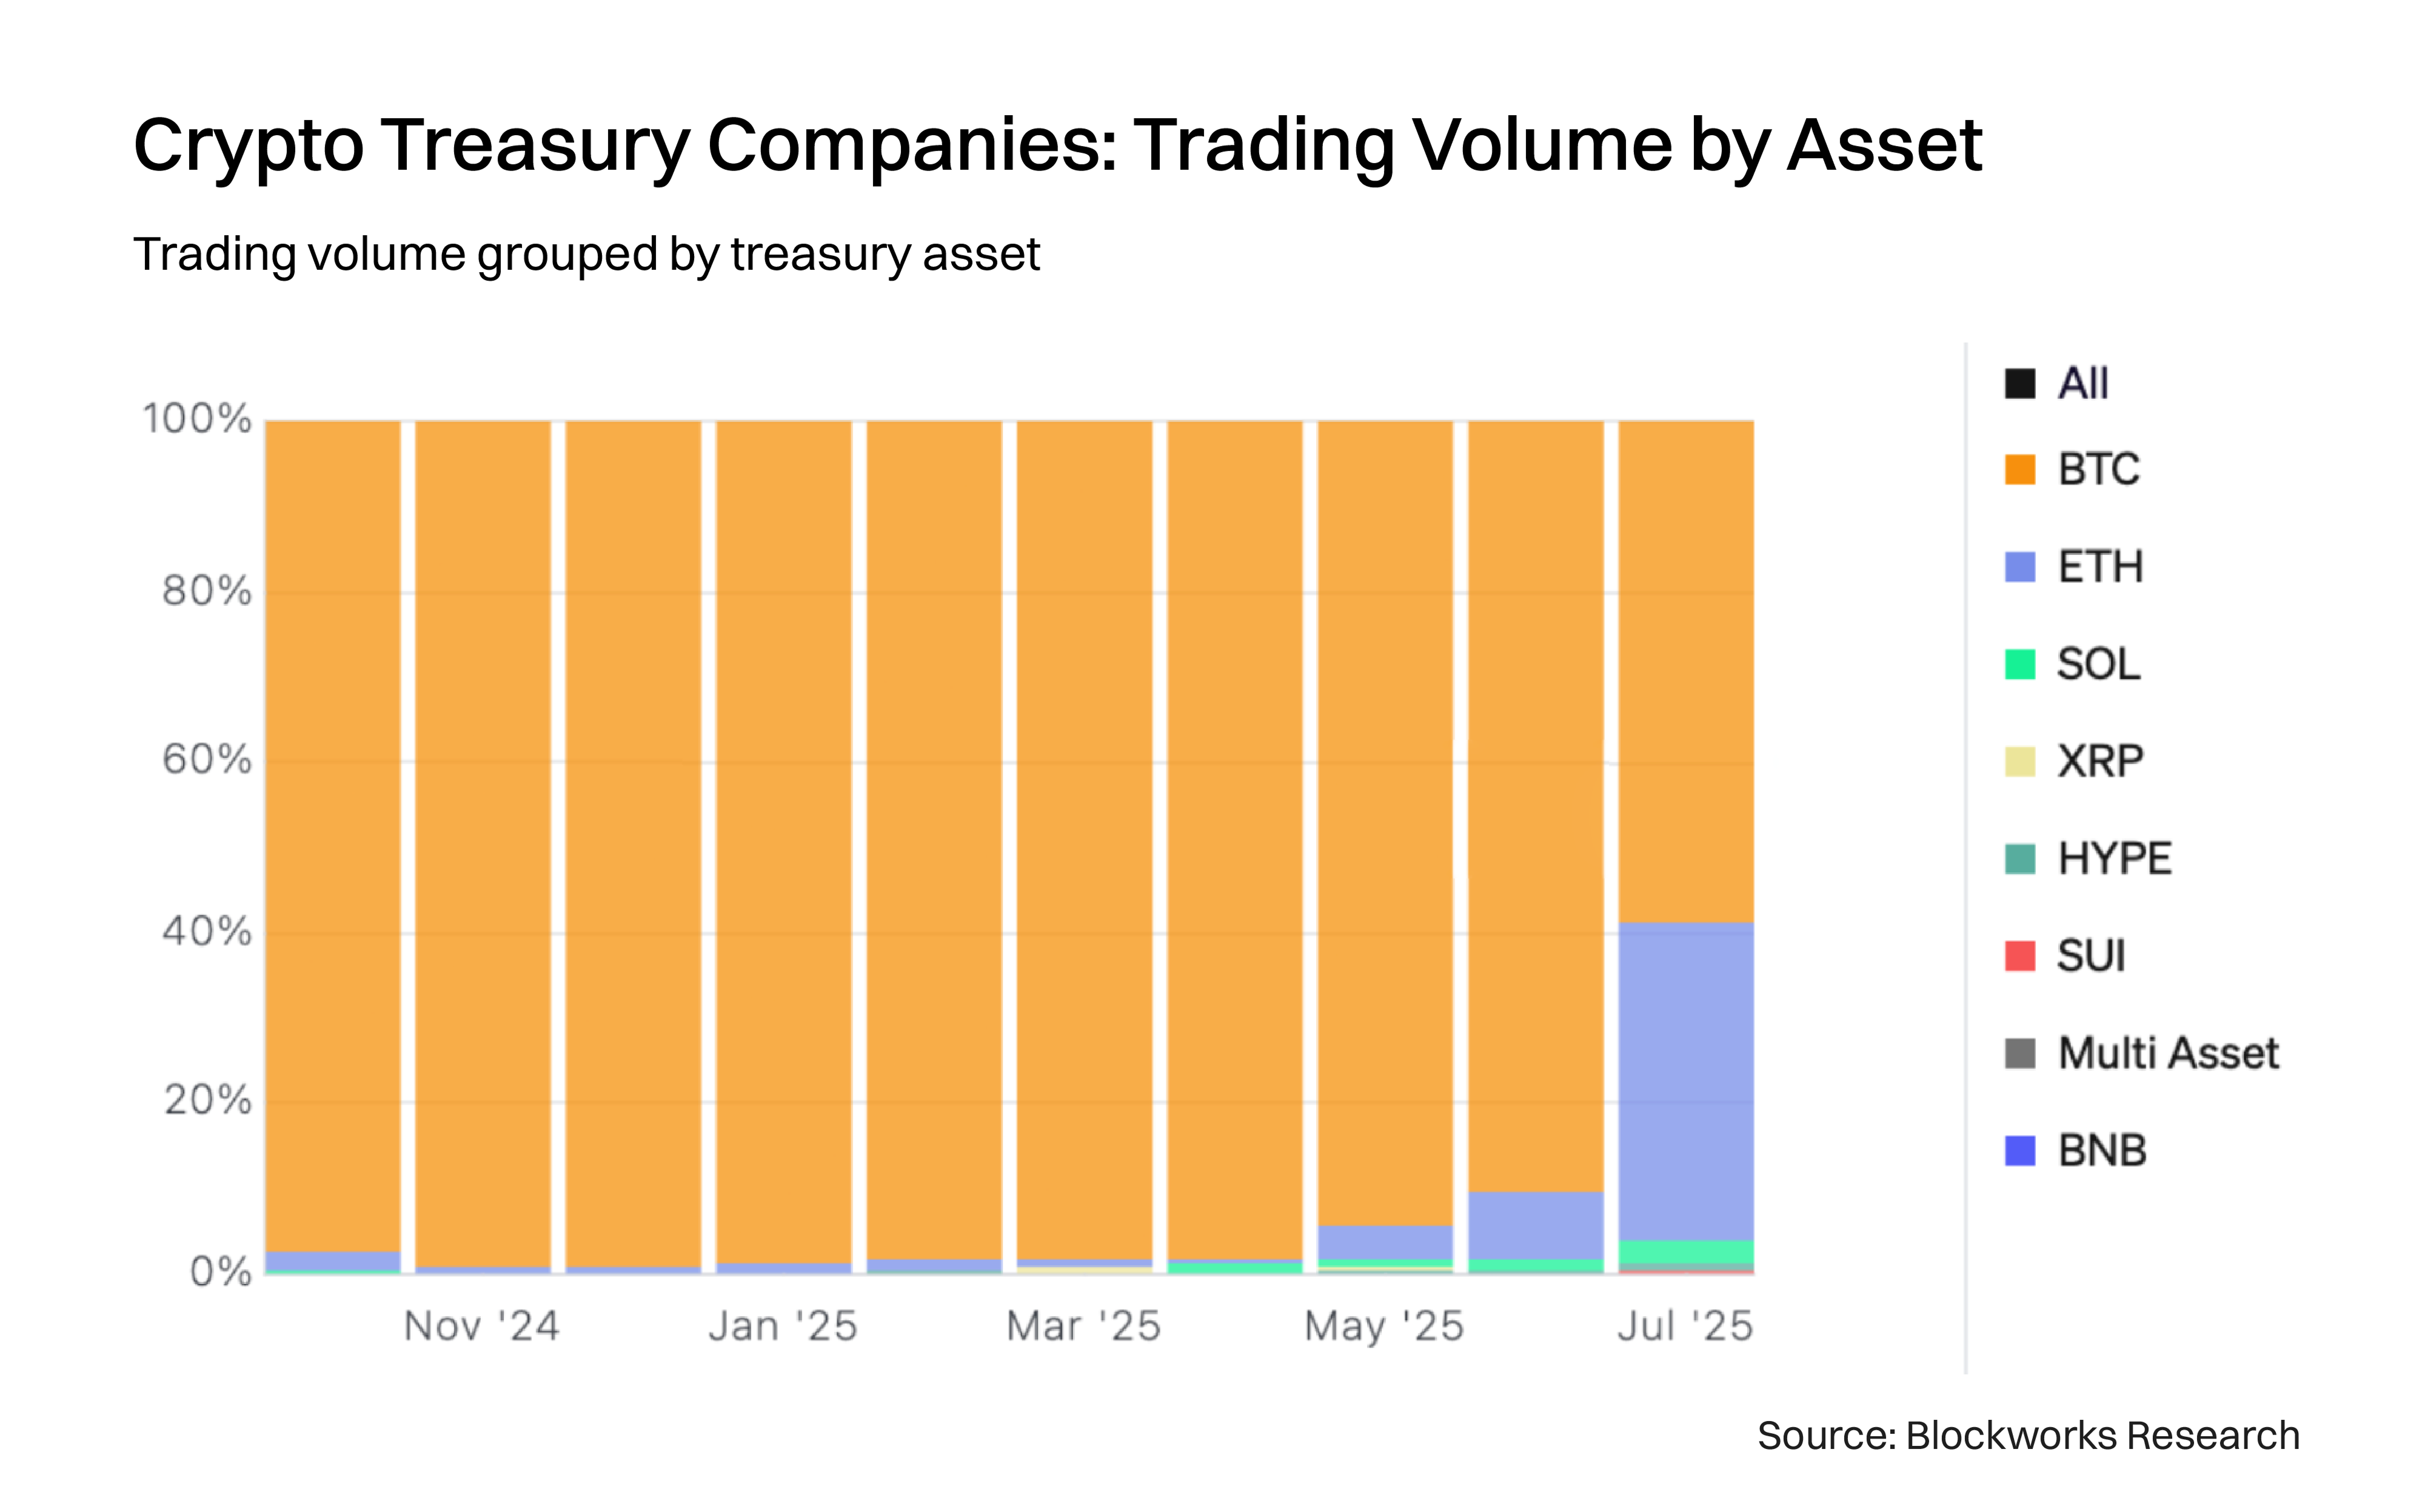
- Trading volumes: ETH DATs captured 37.2% of July’s total DAT trading volume, a notable rise in market share from previous months.
- Leaders: Players like BitMine and SharpLink Gaming have emerged as flagbearers, showing a cliff-like lead in market cap, NAV and liquidity compared with other ETH DATs.
- Strategic advantage: Unlike Bitcoin, Ethereum offers staking yields (around 3%), allowing DATs to compound their treasuries passively. This introduces a structural tailwind for ETH-focused DATs, making them attractive not just for directional exposure but also for yield-based accumulation.
Beyond BTC and ETH: Proof-of-Stake Assets in Focus
Beyond ETH, other proof-of-stake (PoS) assets are also beginning to surface within corporate treasuries:
- Solana: SOL currently accounts for a roughly 7% yield potential, though DAT holdings represent less than 1% of the total SOL supply.
- BNB and Tron: Similarly, the amount of BNB and TRX in DAT holdings remains below 1% of their total supplies, reflecting an early stage of institutional and corporate adoption.
- Relative appeal: The yield mechanics of PoS tokens provide a different investment thesis than Bitcoin. Instead of acting purely as a “digital gold” reserve, they align more with income-generating treasuries.
Supply Absorption and Market Impact
DATs play a growing role in crypto asset absorption:
- BTC: DATs collectively hold 3.52% of the total supply, a concentration that reinforces the thesis of Bitcoin as the institutional reserve asset of choice.
- ETH: DAT holdings amount to 2.52% of the supply, with clear growth momentum as more treasuries adopt staking as part of their accumulation strategy.
- Other assets: While still nascent, corporate accumulation of SOL, BNB and TRX signals the beginning of multi-asset treasury diversification.
The DAT ecosystem has evolved into a two-tier market: Bitcoin DATs dominate in absolute scale and remain the preferred choice for investors seeking pure directional exposure, with MicroStrategy at the helm. On the other hand, ETH DATs are emerging as the growth story, benefiting from rising trading volumes, staking yields and a widening investor base.While other PoS assets like SOL and BNB are still minor players, their yield-generating characteristics position them as potential future entrants into the DAT spotlight. But for now, the market narrative is defined by a BTC fortress of scale vs. ETH’s yield-driven momentum.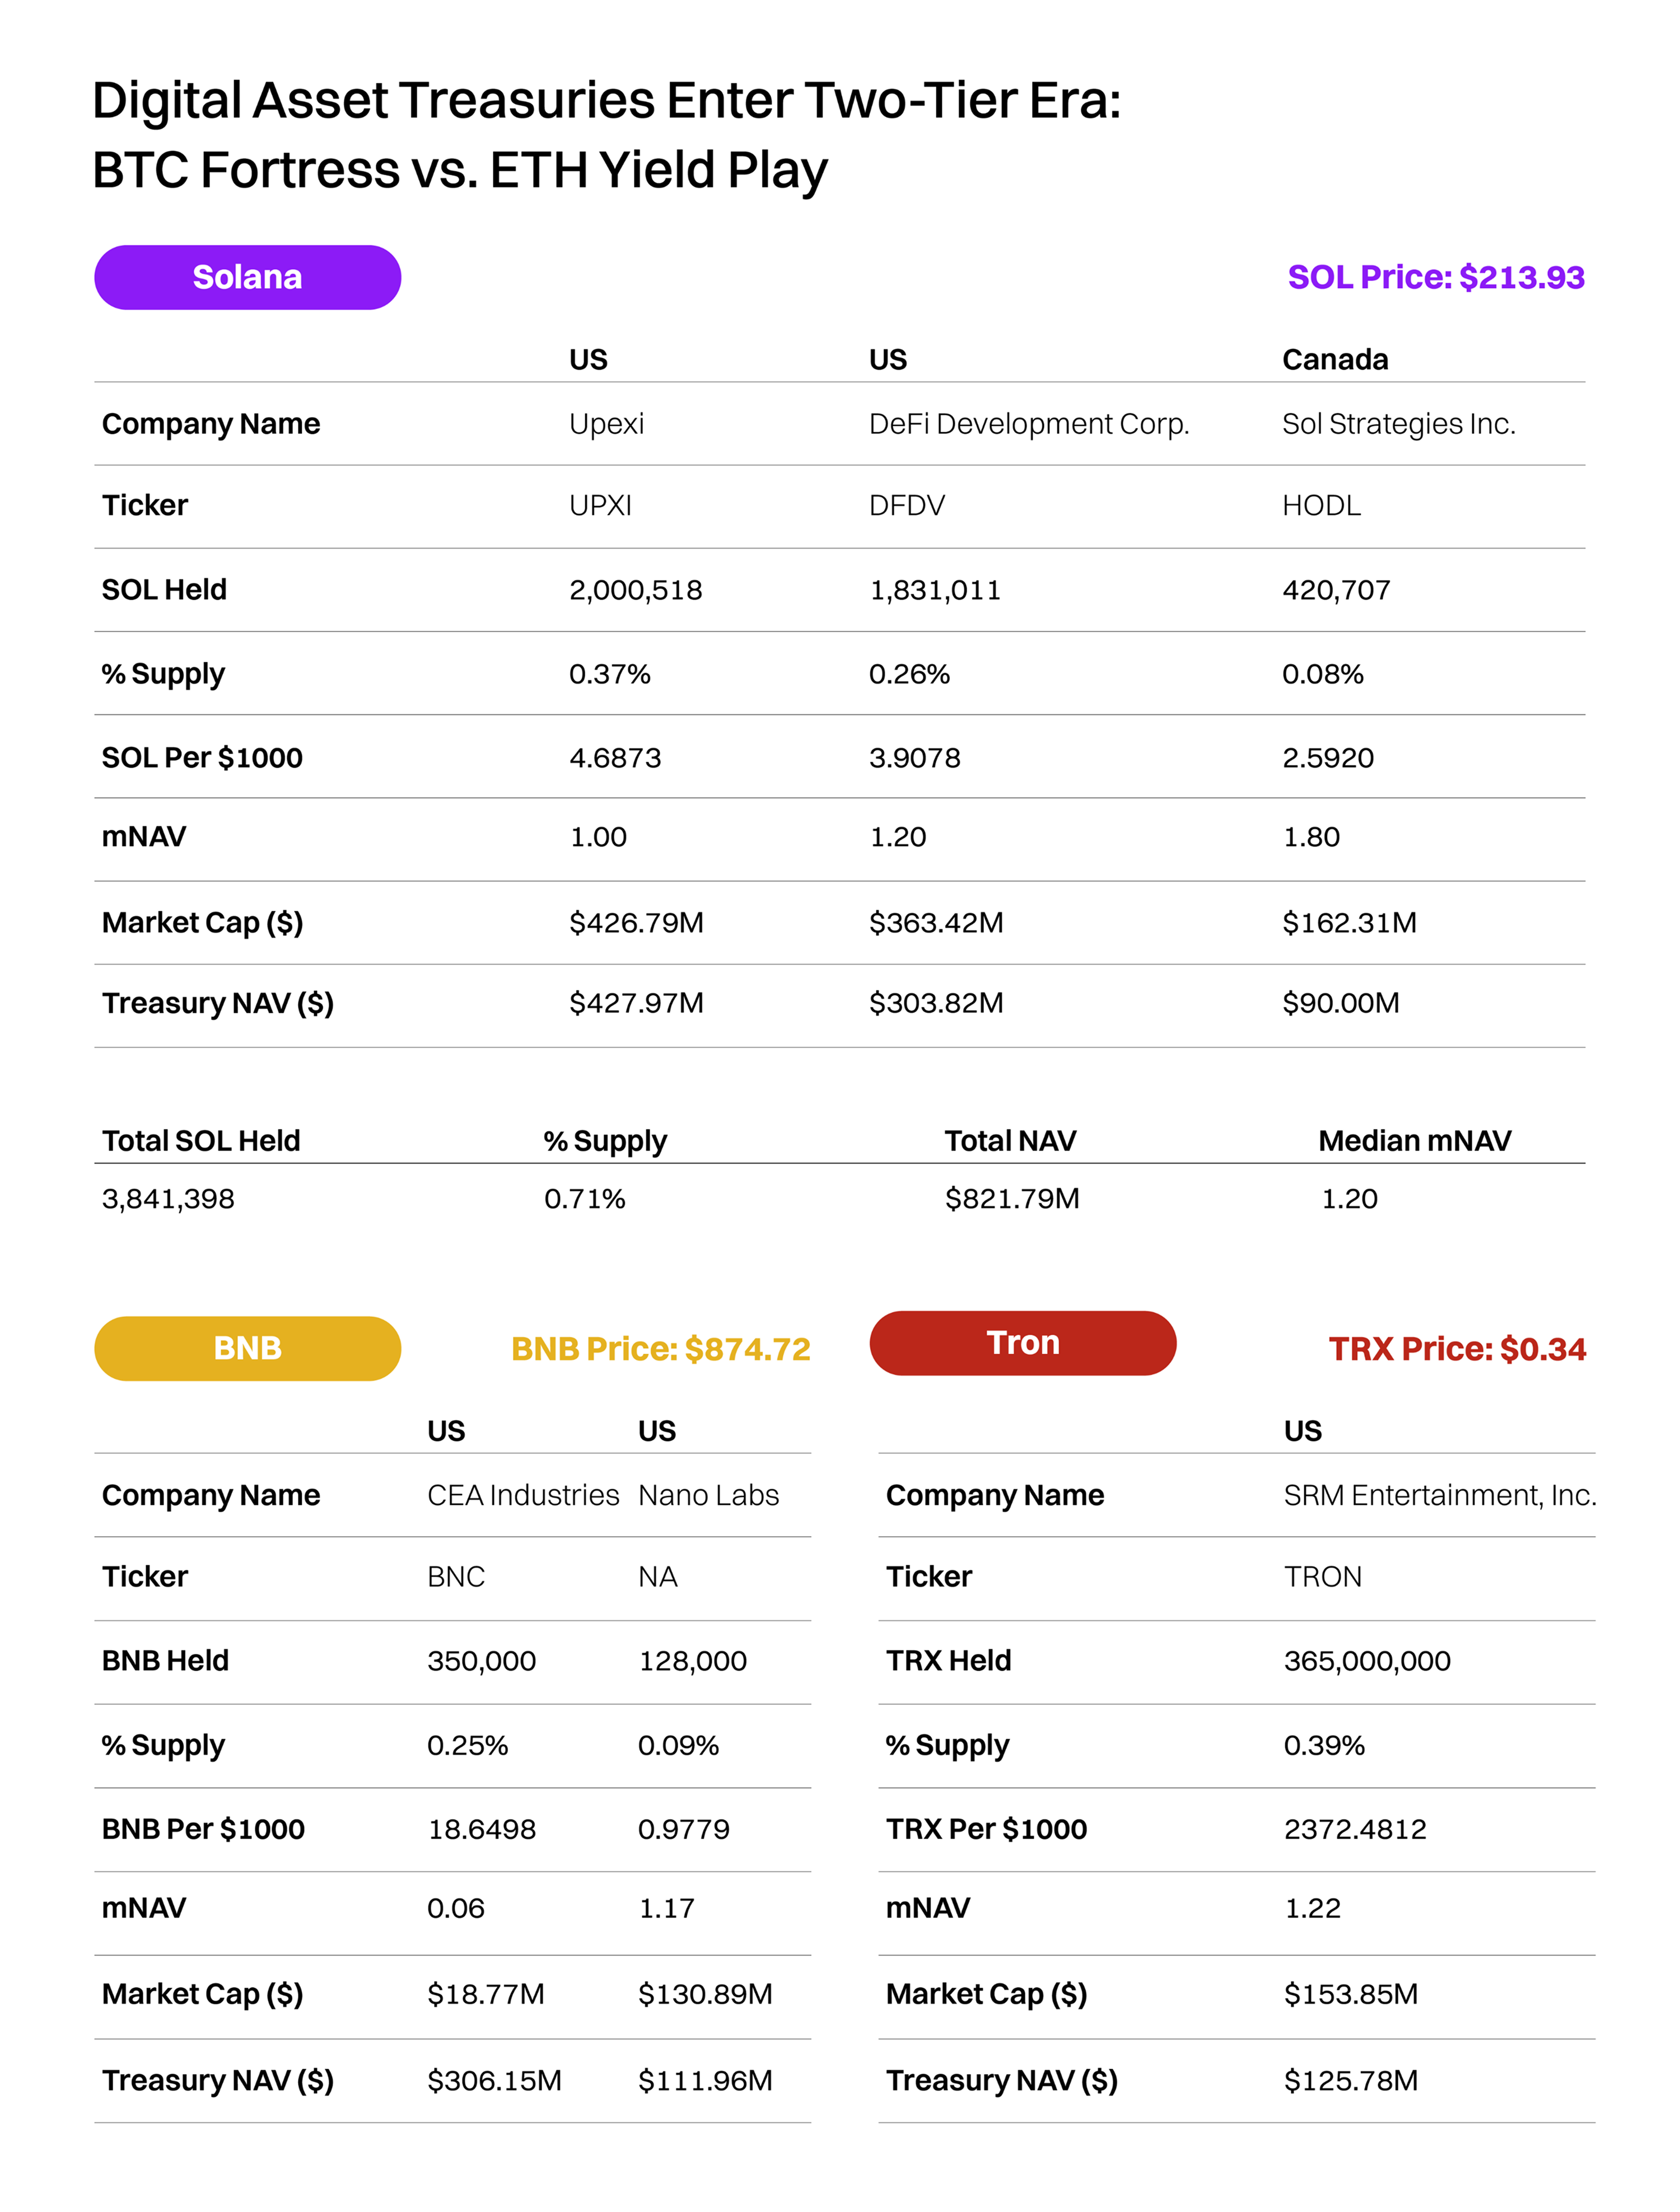


, notching another record high after bouncing back from a brief dip four days earlier.")


