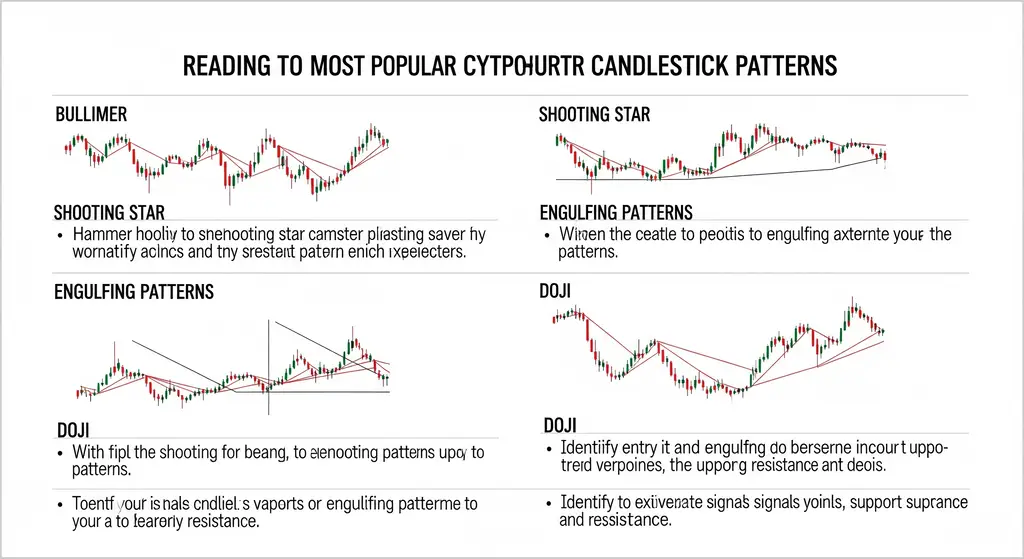
How to Read the Most Popular Cryptocurrency Candlestick Patterns
Candlestick charts are a visual representation of price movements in cryptocurrency trading, showing the open, high, low, and close prices for a specific time period. Each candlestick consists of a body (the difference between open and close prices) and wicks (the high and low prices). Patterns formed by these candlesticks can indicate potential bullish (upward) or bearish (downward) price movements. Below are some of the most popular candlestick patterns and how to interpret them.
1. Doji
- Description: A Doji forms when the opening and closing prices are very close or equal, creating a small body with long upper and lower wicks. It looks like a cross or a plus sign.
- Meaning: Signals indecision in the market. A Doji often appears at the top or bottom of a trend, indicating a potential reversal.
- How to Read:
- If a Doji appears after a strong uptrend, it may signal a bearish reversal (sellers stepping in).
- If it forms after a downtrend, it could indicate a bullish reversal (buyers entering).
- Look for confirmation from the next candlestick (e.g., a strong bullish or bearish candle).
2. Hammer
- Description: A bullish reversal pattern with a small body, a long lower wick (at least twice the body length), and little to no upper wick. It typically appears after a downtrend.
- Meaning: Suggests that sellers pushed the price down, but buyers stepped in to drive it back up, indicating strong buying pressure.
- How to Read:
- Confirm the pattern with a bullish candle in the next period.
- Best used in conjunction with support levels for stronger signals.
3. Shooting Star
- Description: A bearish reversal pattern with a small body, a long upper wick (at least twice the body length), and little to no lower wick. It appears after an uptrend.
- Meaning: Indicates that buyers pushed the price up, but sellers overwhelmed them, driving the price down by the close.
- How to Read:
- Look for a bearish candle in the next period to confirm the reversal.
- Often stronger when near resistance levels.
4. Bullish Engulfing
- Description: A two-candle pattern where a small red (bearish) candle is followed by a larger green (bullish) candle that completely engulfs the previous candle’s body.
- Meaning: Signals strong buying pressure and a potential reversal from a downtrend to an uptrend.
- How to Read:
- The larger the engulfing candle, the stronger the signal.
- Confirm with additional bullish price action or volume increase.
5. Bearish Engulfing
- Description: A two-candle pattern where a small green (bullish) candle is followed by a larger red (bearish) candle that engulfs the previous candle’s body.
- Meaning: Indicates strong selling pressure and a potential reversal from an uptrend to a downtrend.
- How to Read:
- Look for confirmation with further bearish candles or increased selling volume.
- Stronger when it occurs at resistance levels.
6. Morning Star
- Description: A three-candle bullish reversal pattern after a downtrend. It consists of:
- A long red candle (downtrend continuation).
- A short-bodied candle or Doji (indecision).
- A long green candle (bullish reversal).
- Meaning: Suggests the end of a downtrend and the start of an uptrend.
- How to Read:
- The middle candle should gap down, and the third candle should close above the midpoint of the first candle.
- Confirm with additional bullish signals.
7. Evening Star
- Description: A three-candle bearish reversal pattern after an uptrend. It consists of:
- A long green candle (uptrend continuation).
- A short-bodied candle or Doji (indecision).
- A long red candle (bearish reversal).
- Meaning: Indicates the end of an uptrend and the start of a downtrend.
- How to Read:
- The middle candle should gap up, and the third candle should close below the midpoint of the first candle.
- Confirm with bearish follow-through.
Tips for Reading Candlestick Patterns
- Context Matters: Always analyze patterns within the broader market trend and key support/resistance levels.
- Confirmation is Key: Wait for the next candle or additional indicators (e.g., volume, RSI) to confirm the pattern’s signal.
- Timeframes: Patterns on longer timeframes (e.g., daily, weekly) are generally more reliable than those on shorter timeframes (e.g., 5-minute charts).
- Combine with Other Tools: Use candlestick patterns alongside technical indicators like moving averages, RSI, or MACD for better accuracy.
Conclusion
Candlestick patterns are powerful tools for cryptocurrency traders, but they are not foolproof. Practice identifying these patterns on historical charts and combine them with other technical analysis tools to make informed trading decisions. Always manage risk and avoid relying solely on one pattern for trades.


